Can Starknet (STRK) Price Break The Downtrend Soon?
 thecoinrepublic.com 04 September 2024 01:50, UTC
 Starknet (STRK) price had declined by nearly 90% from the first quarter peak of $3.66. But, intraday, it performed better than other market leaders. Over the past day, STRK’s price gained nearly 2.30% to trade at $0.3673.
Most altcoins tend to move per the BTC’s price movement, presently STRK is an exception. It has a BTC correlation score of 0.62, which is lesser compared to other bigger altcoins.
Intraday, the $58000 level was critical for BTC to enter an uptrend. But severe concern globally arose when it slipped hold of $58000 in the last 24 hours. Starknet price staying green in the red global market. The bearish long-term narrative of STRK price has not changed yet.
STRK was seamlessly deflected from time to time by the 20-day and 50-day EMA bands. Many altcoins have shown growth, whether less or higher, from August 5th. This has turned into an important day for the crypto.
However, the Starknet price failed to meet many investors’ expectations by showing strong consolidation.
How STRK’s Market Dynamics Could Explain the Weak Buying Pressure?
The Starknet tremendous supply of 10 Billion tokens has minted only 17.80% of STRK’s in floatation. Precisely, 1.77 Billion tokens are there, and per the Coincarp website, 13.9K holders in total hold this floating supply.
Similarly, the previous investments have been lost, per an on-chain research website. Precisely, it has been noted that 11.68K addresses or nearly 84.99% of the holders are bearing losses in their positions.
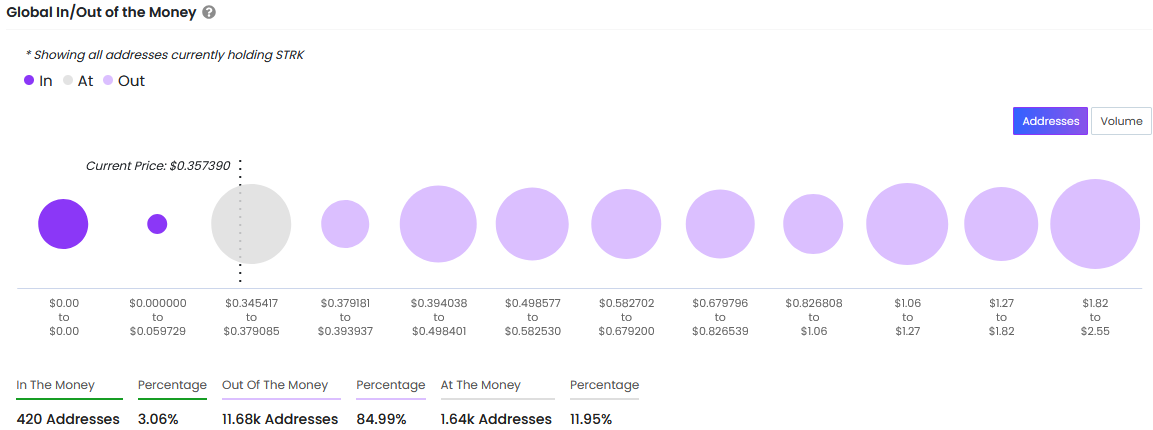
While 1.64K addresses, nearly 11.95% are at breakeven prices, the only addresses that are in profit are 420 addresses, which lets us assume that those addresses might have been bought late in August.
Therefore, based on its price performance in August and on-chain research data. two theories pop up: firstly, accumulation could be a major sign of heavy-duty accumulation at the lowest depths (buy-on-dip). Secondly, the suspicion among investors related to its supply dynamics could be an issue for many, creating a lack of lustrous movement.
Will STRK Break Hurdles Above and Rise?
Over the daily chart, from March 2024, Starknet’s price plunged, turning investors’ gains into losses. STRK’s freefall led to the formation of a converging downward wedge pattern.
The fall began after the failure to break past the $2.780 (ATH) on March 13th, 2024. The fall took a halt at $1.11 by mid-April 2024 and caused many to think of that very sideways action as a sustenance, which failed.
The consolidation in price kept the movement in a horizontal range. STRK struggled to surpass the $1.36 resistance level. This struggle led to a fall below the psychological $1 mark and reached $0.460 by mid-July 2024, coinciding with the channel’s lower border.
On July 5th, the price attempted to rise, but this time, it did not even manage to cross $0.637 and deteriorated more in the rest ofJuly.
Now, as observed above, similar to April’s earlier sideways movement has started in August 2024, too. A rerun of April could mean prolonged bearishness.
On the contrary, if this price action of August is indeed a breakout, then STRK must show a bullish confirmation by crossing above $0.637. Then STRK could potentially enter a major uptrend.


