
Shiba Inu (SHIB) Bulls Fail, Setting Stage for 23% Decline
 beincrypto.com 04 September 2024 10:15, UTC
 Shiba Inu (SHIB), a leading meme coin, has been trading within a horizontal range since August 8. While it briefly surged past the upper boundary of this channel, it failed to sustain the breakout and dropped back below resistance on August 28.
Following this, SHIB moved toward the channel’s lower boundary, which acted as support. However, the coin has now broken below this key level, signaling increased selling pressure and the likelihood of further declines in SHIB’s value.
Shiba Inu Bulls Lose Grip on Market
A market is said to be in consolidation when an asset trades within a horizontal channel, meaning its price moves within a defined range for a period of time. The upper boundary of this channel represents resistance, while the lower boundary acts as support.
In the case of Shiba Inu (SHIB), this consolidation saw the asset facing resistance at $0.000014, while bulls provided support at $0.000012. This sideways movement highlighted the balance between buying and selling pressures in the SHIB market, preventing the coin’s price from making a strong move in either direction during this period.
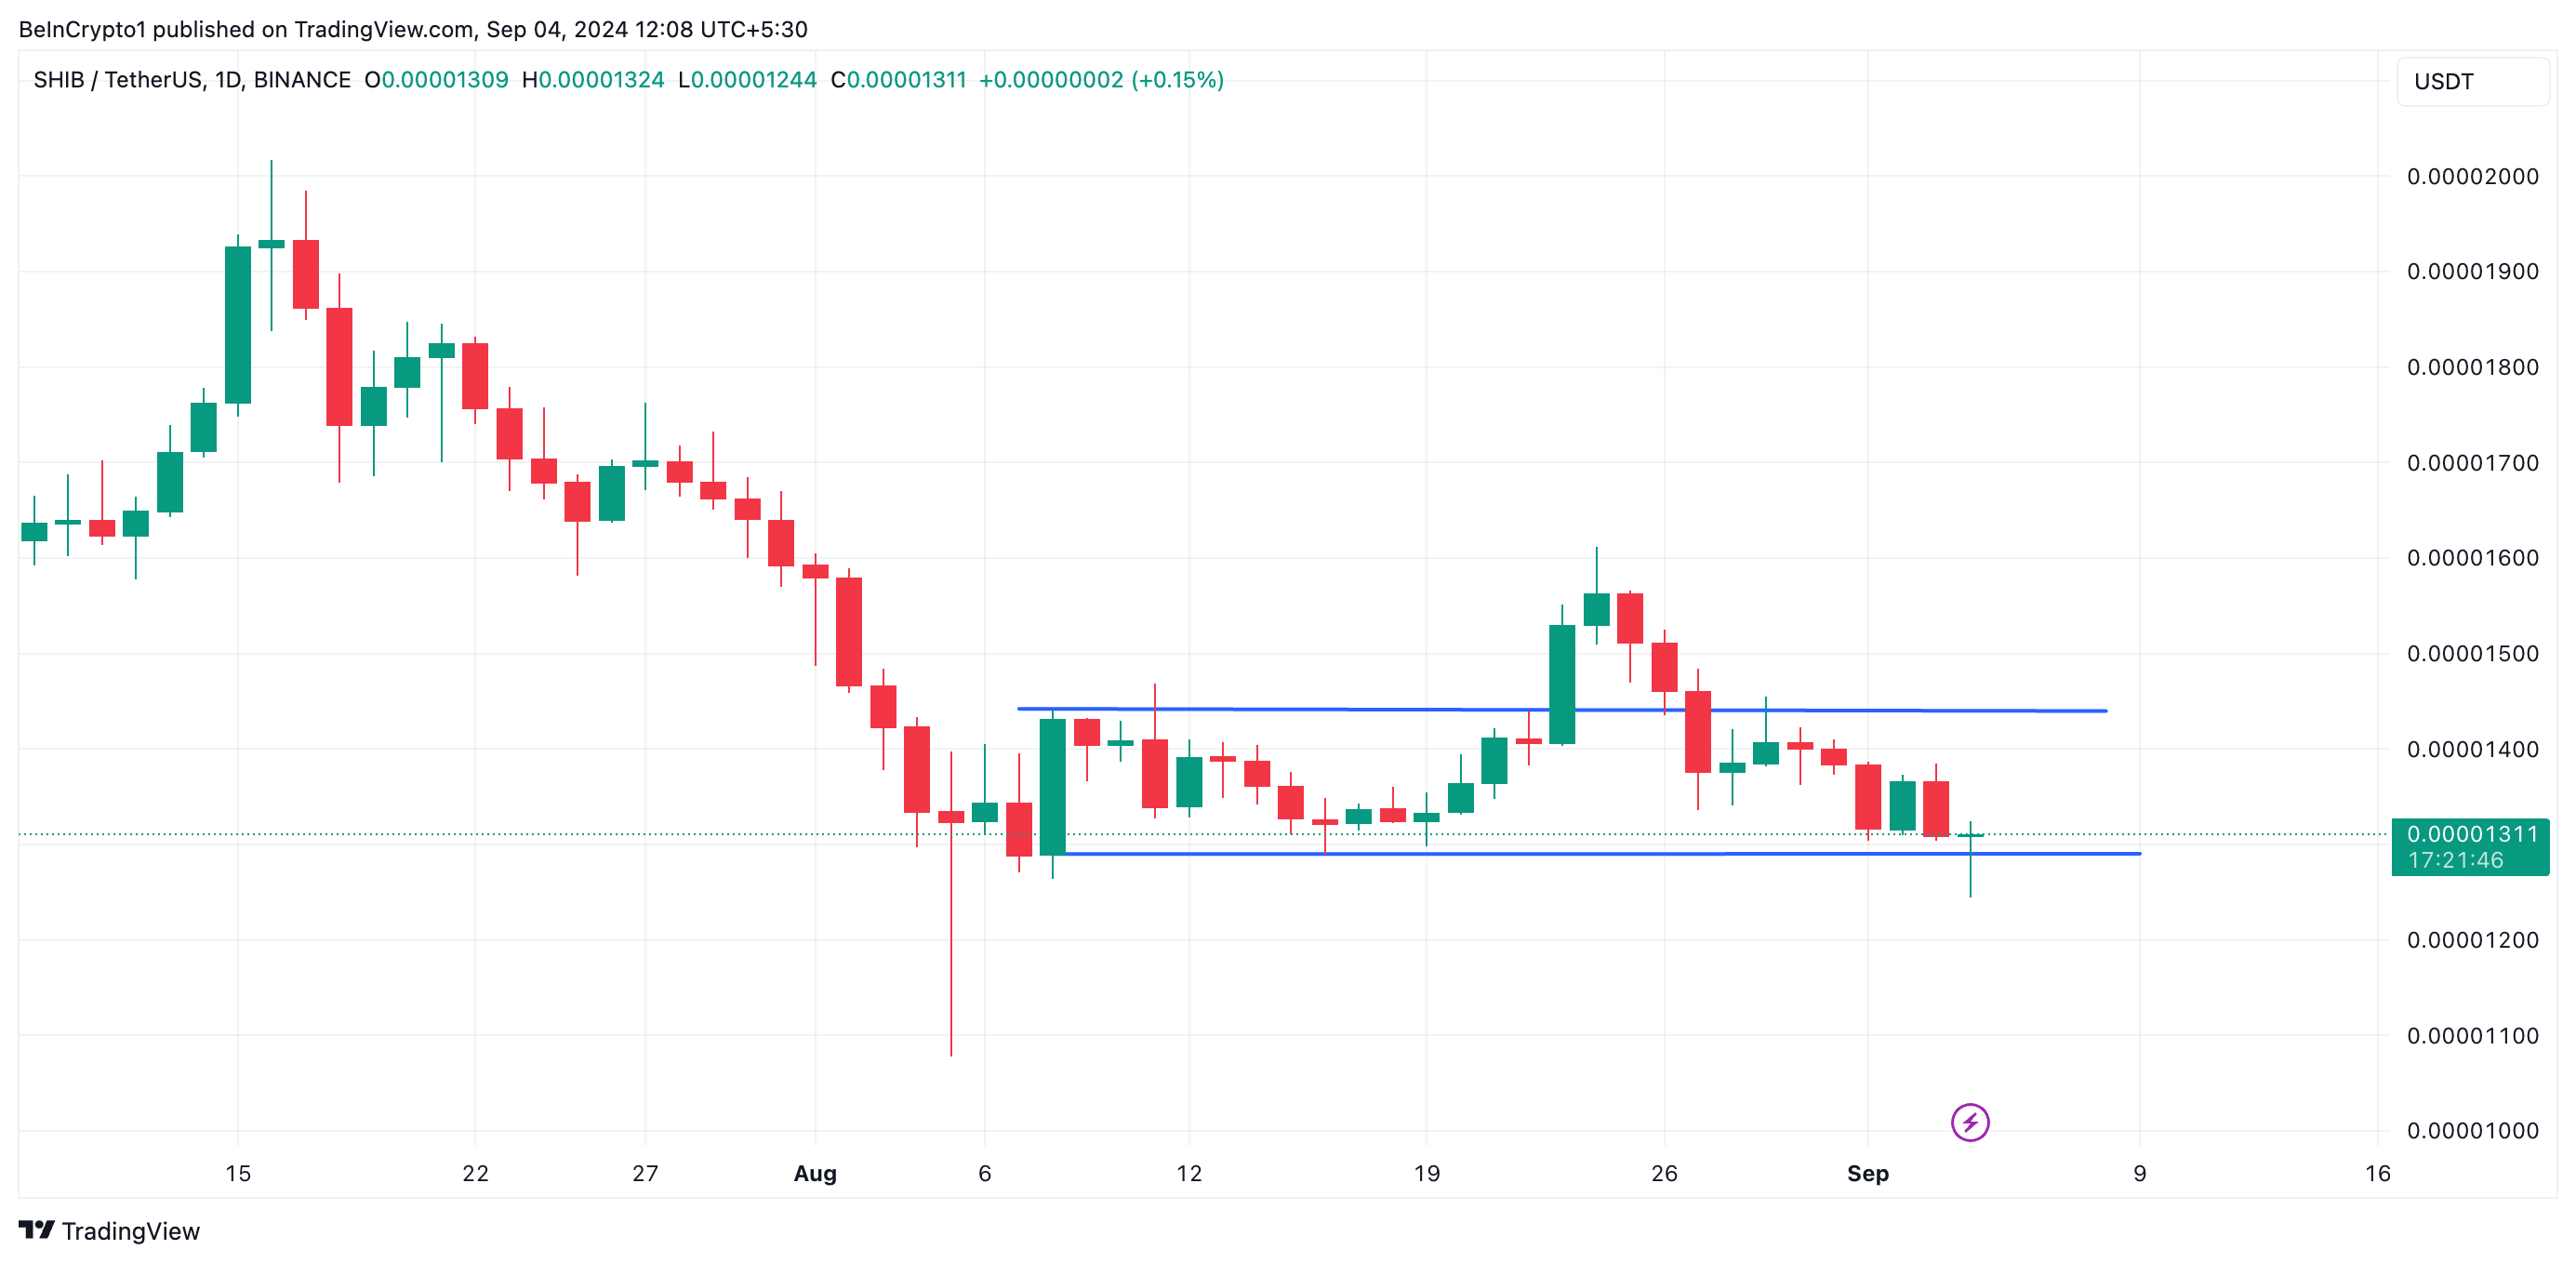
Shiba Inu’s recent breakdown below the lower boundary of its consolidation channel indicates that bulls failed to defend a critical support level. This suggests that selling pressure from bears has overtaken buying interest, often signaling a shift in market sentiment from neutral or positive to negative and pointing to the potential for further price declines.
Technical indicators confirm this bearish trend. On the one-day chart, Shiba Inu’s Directional Movement Index (DMI) reveals that its positive directional index (+DI) (blue) is positioned below the negative directional index (-DI) (red).
The DMI measures the strength and direction of a trend, and when the +DI falls below the -DI, it signals that bearish conditions are prevailing, with selling activity dominating the market.
Read more: How To Buy Shiba Inu (SHIB) and Everything You Need To Know
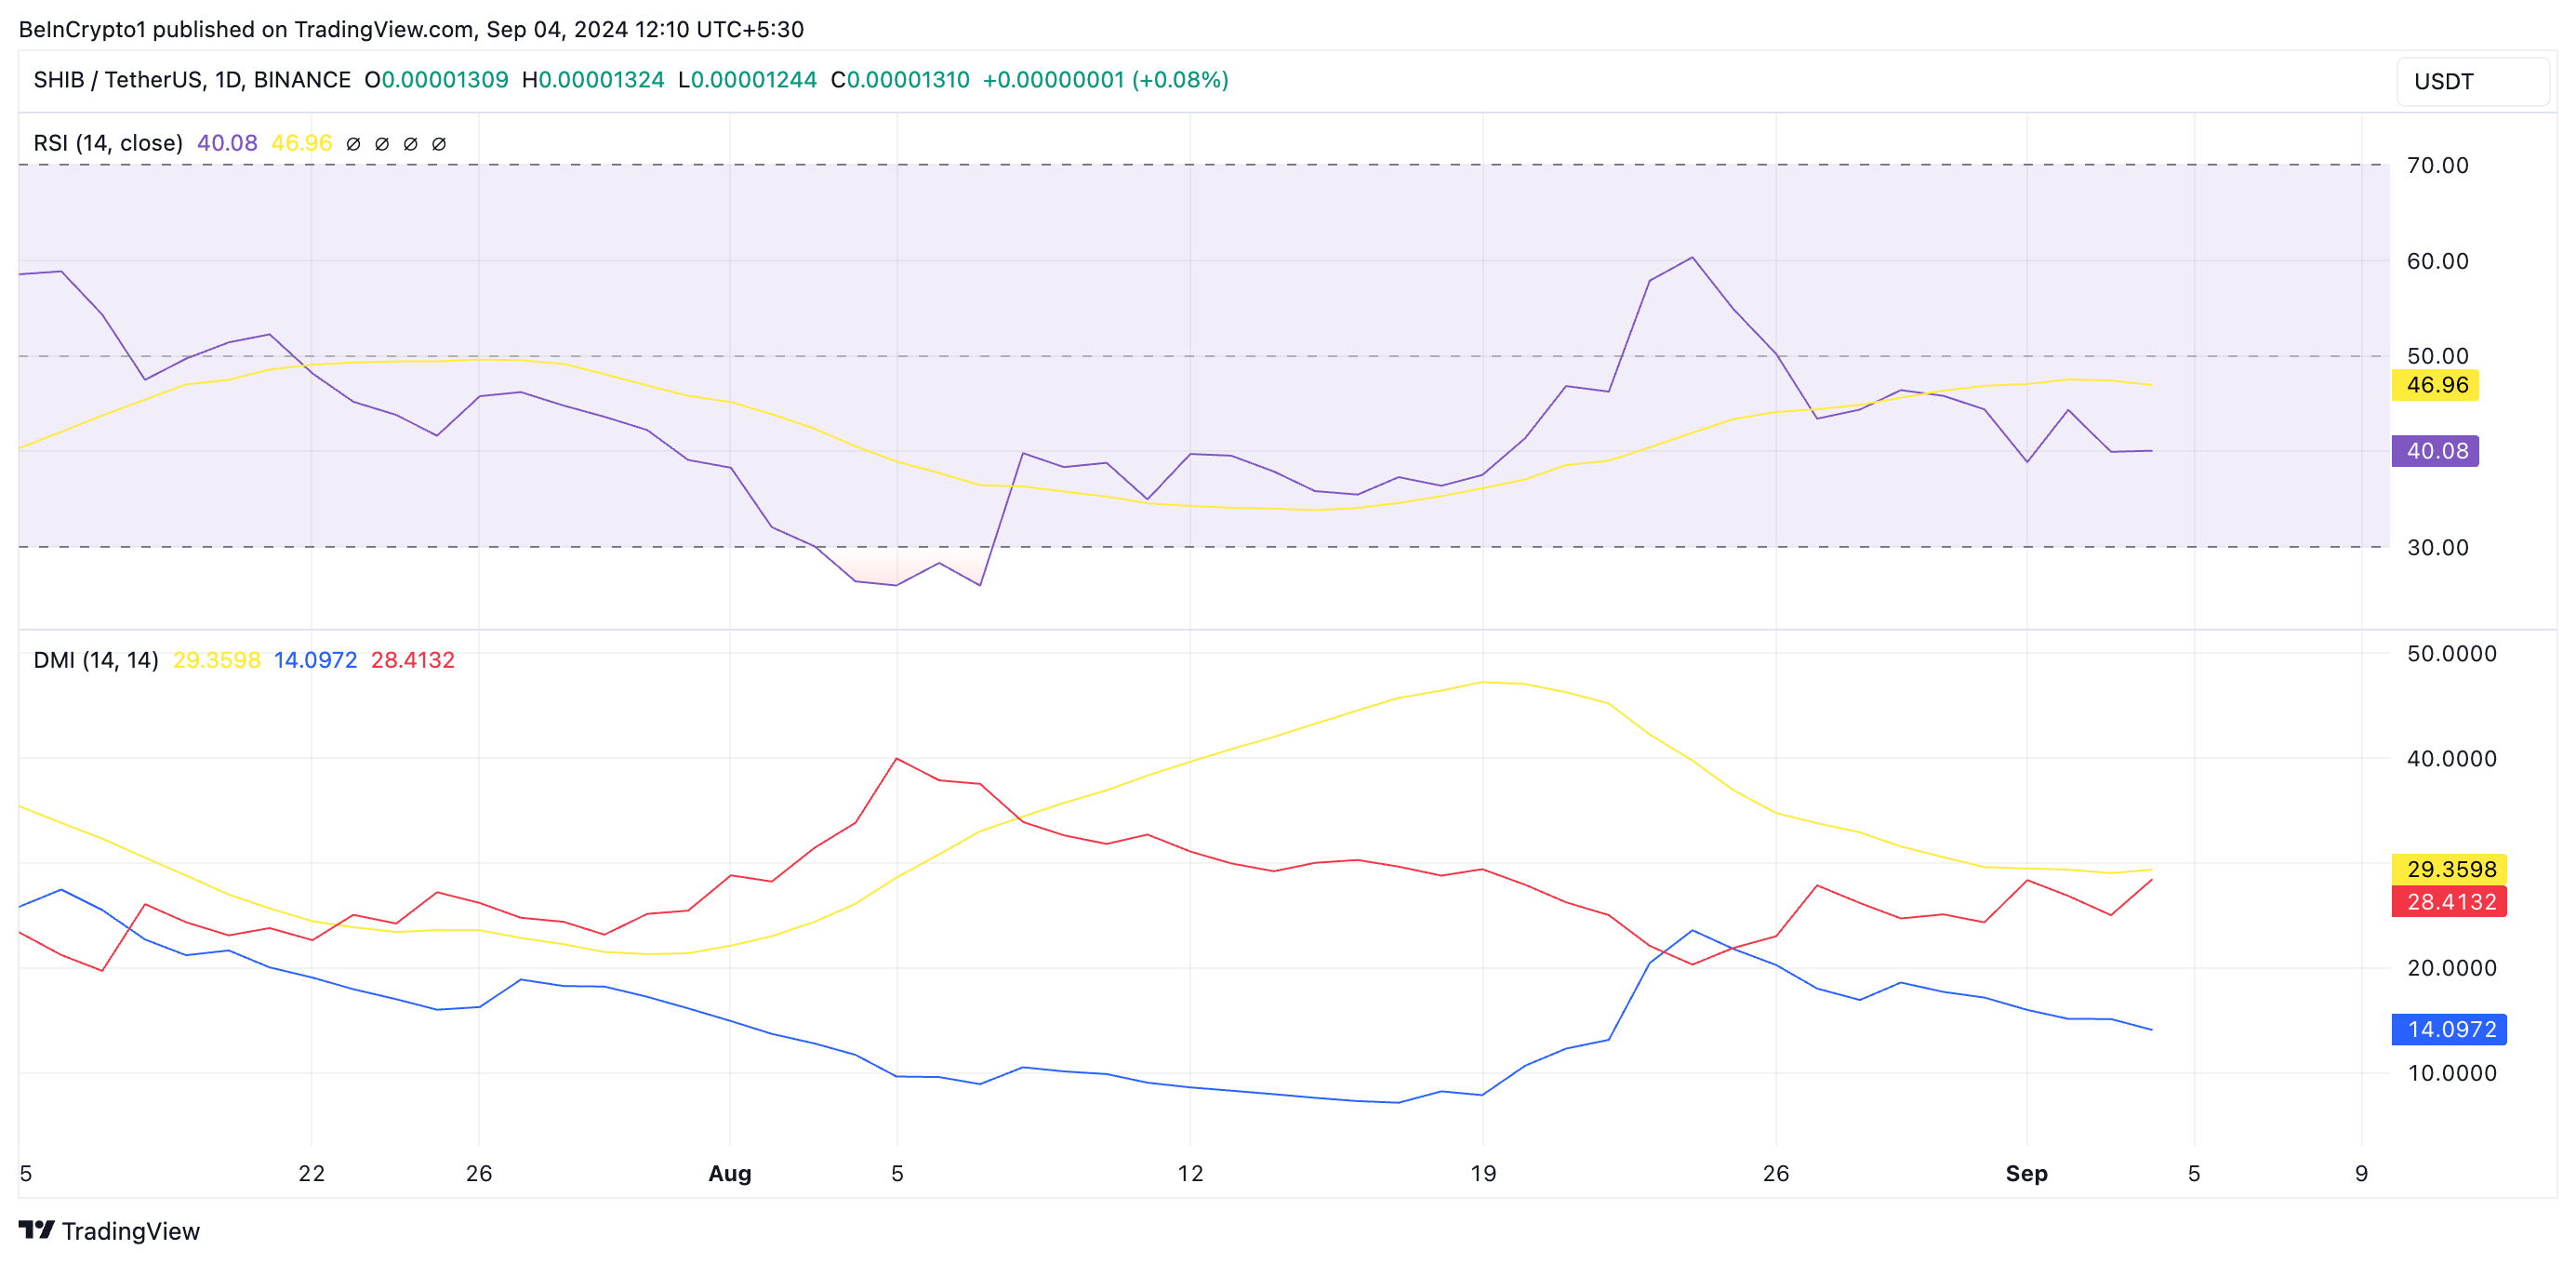
Confirming the uptick in selling activity, the meme coin’s Relative Strength Index (RSI) was below its 50-neutral spot and downtrend at press time. At 40.30, SHIB’s RSI suggests that market participants favor coin distribution over accumulation, putting more pressure on its price.
SHIB Price Prediction: A 23% Price Drop Is Possible
If Shiba Inu (SHIB) retests its recent breakout and successfully reverses, it could signal the start of a new uptrend. With sufficient buying pressure, SHIB’s price might rally toward the resistance level of $0.000014 and potentially break above it.
If this occurs, the meme coin could aim for the $0.000018 mark.
Read more: Shiba Inu (SHIB) Price Prediction 2024/2025/2030
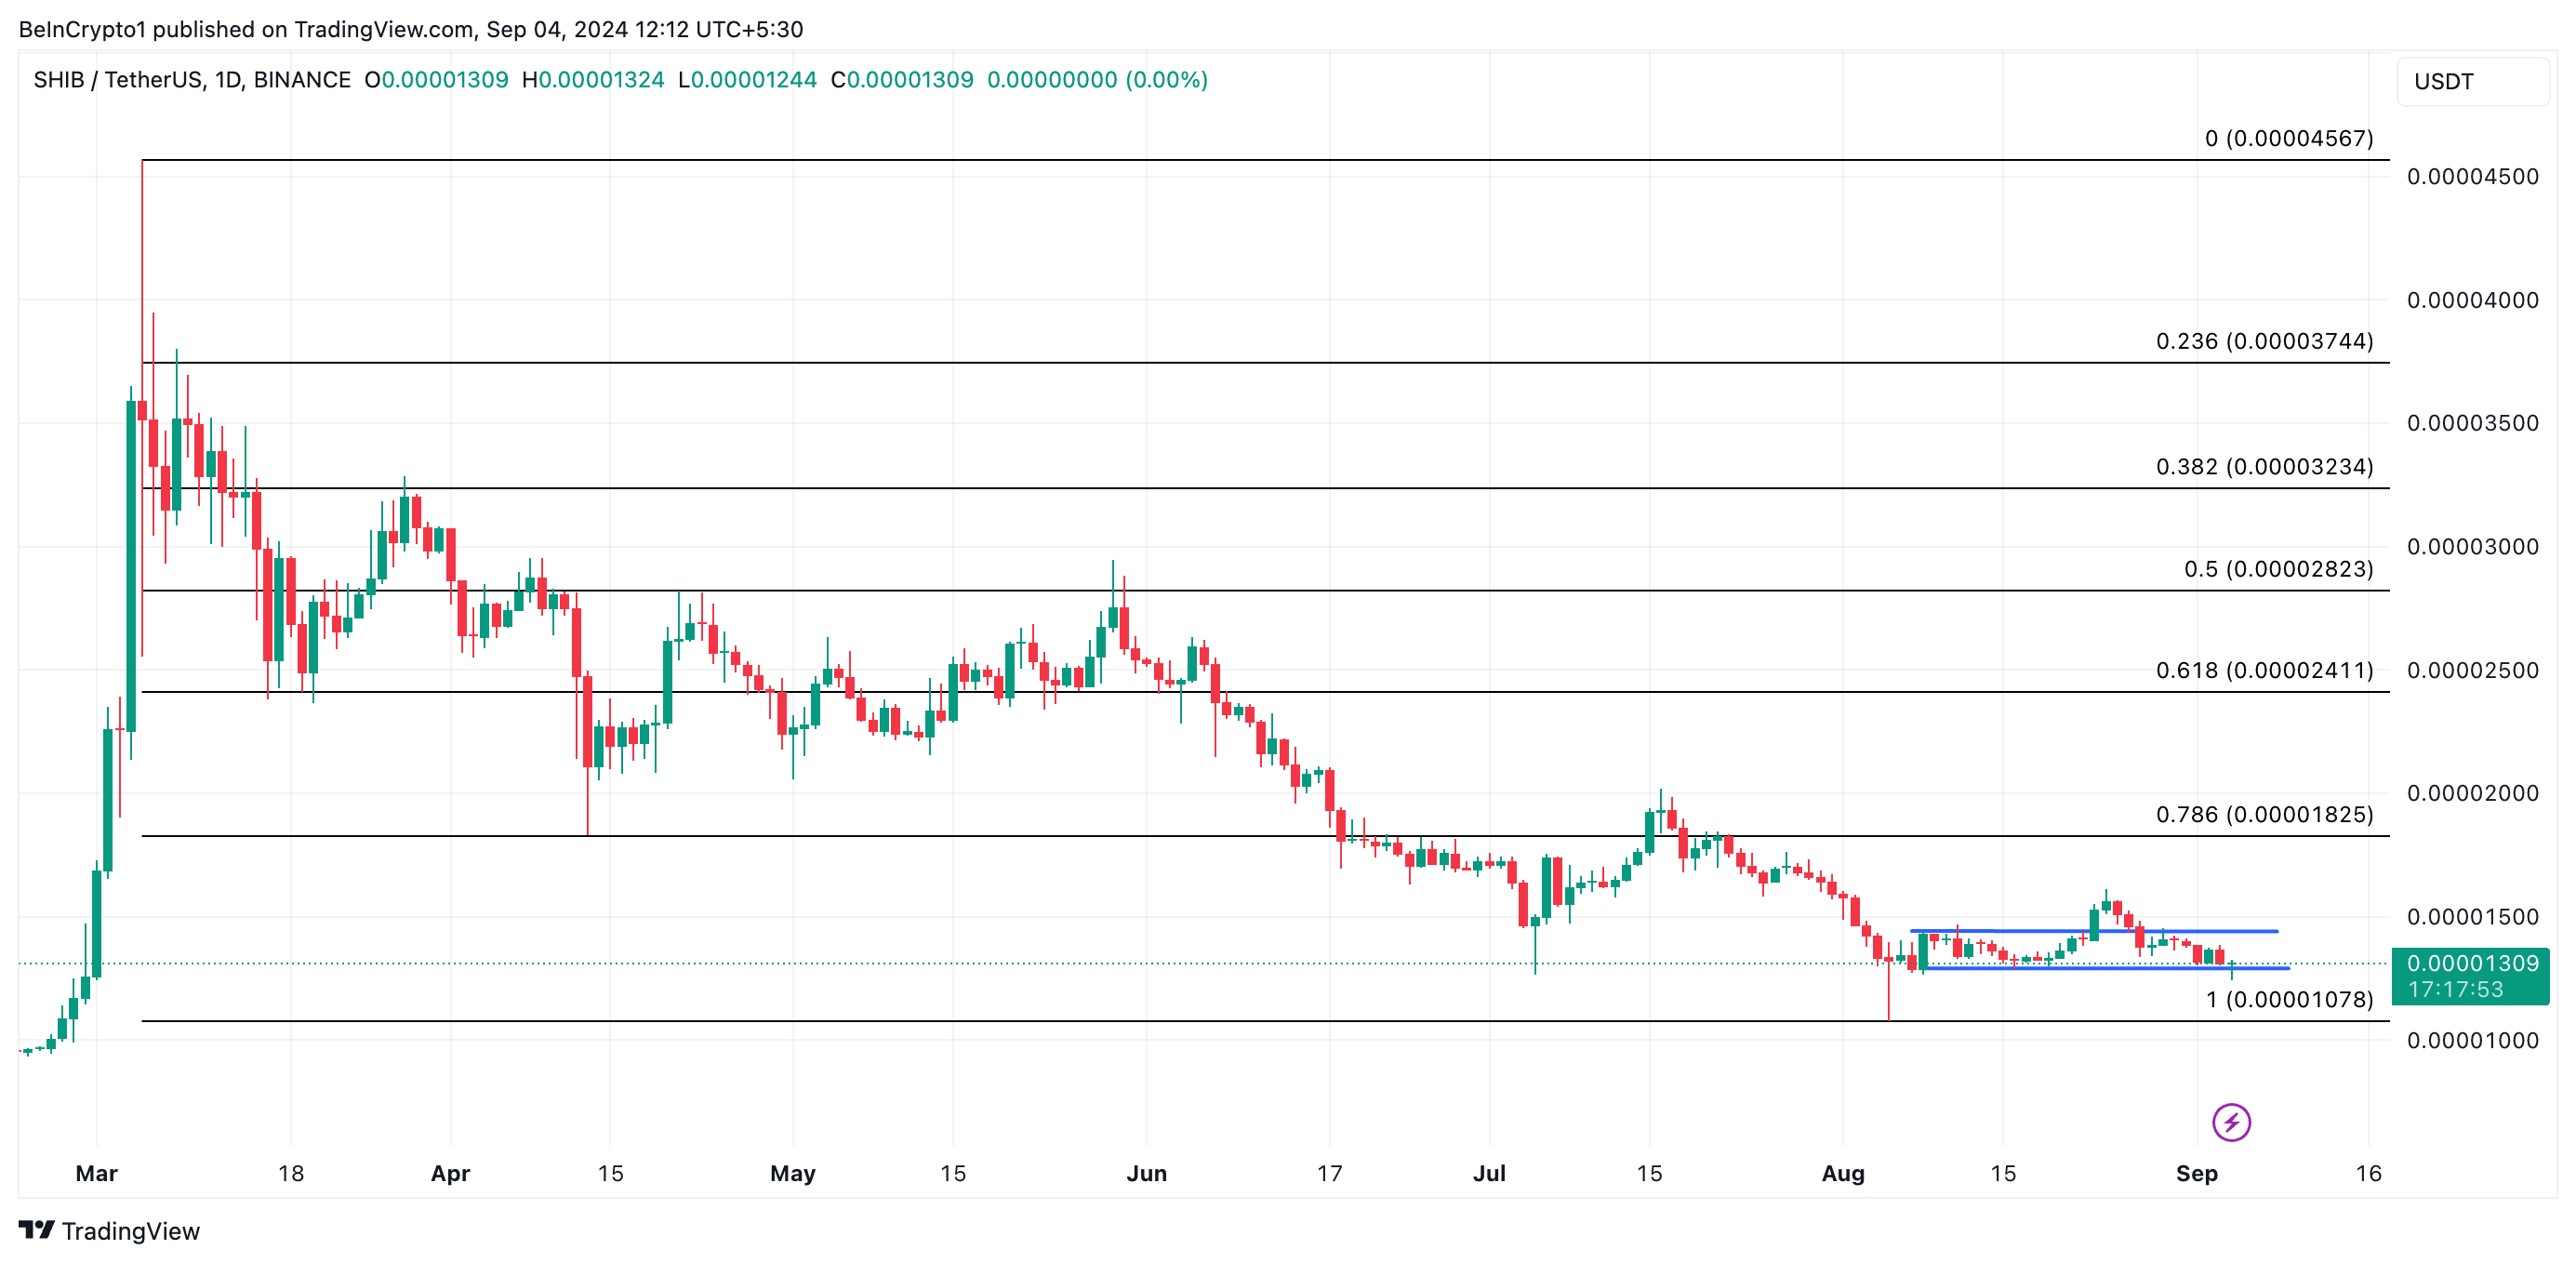
However, if the current downtrend persists, SHIB’s value could face a further 23% drop, bringing it back to its August 5 low of $0.00001. This scenario would indicate a deeper bearish outlook, with selling pressure continuing to weigh on the coin’s price.


