
Bitcoin struggles around $57,000 as institutions load off BTC holdings
 fxstreet.com 05 September 2024 15:15, UTC
 - Bitcoin price approaches a crucial support level at $56,000; a close below could see its downtrend persist.
- Lookonchain and Arkham intelligence data show that institutions are selling their BTC holdings.
- On-chain data shows a bearish picture, such as falling daily active addresses and decreasing Coinbase premium index.
Bitcoin (BTC) recovered on Wednesday after retesting its daily support level of around $56,000, but the 2.15% decline on Thursday suggests this rebound may be fleeting. The downtrend may persist if BTC drops below the $56,000 support, evidenced by Lookonchain and Arkham intelligence data indicating institutional selling, alongside bearish on-chain signals such as decreasing daily active addresses and a declining Coinbase premium index.
Daily digest market movers: Bitcoin shows weakness as intuitions sell off their BTC holdings
- Lookonchain data shows that institutions might be selling their BTC holdings. Ceffu, an institutional custody, asset management and off-exchange settlement solutions company, deposited 2,000 BTC from Monday to Wednesday and, in total, 3,063 BTC worth $182 million into the Binance exchange since August 26. This transfer to the crypto exchange could signal that Ceffu is ready to sell these holdings.
Furthermore, Arkham intelligence data shows that eight Bitcoin spot EFTs sold $287 million BTC on Wednesday. This sell-off from institutional investors would increase the selling pressure and weight on Bitcoin’s price.
It seems that institutions are selling $BTC!#Ceffu has deposited 3,063 $BTC($182M) into #Binance since Aug 26.https://t.co/yObVfoTnB1 pic.twitter.com/oaZKEZh2WJ
— Lookonchain (@lookonchain) September 4, 2024
EIGHT ETFs sold $287 MILLION BTC in the past 24 hours.
Except BlackRock.
BlackRock sold 0. pic.twitter.com/rWNw7FraUH
— Arkham (@ArkhamIntel) September 4, 2024
- US Senator Cynthia Lummis had introduced her proposal, the Bitcoin Act. The bill aims for the US to purchase 1 million BTC over five years, signaling institutional interest and potential government backing for Bitcoin and further enhancing its legitimacy and appeal.
“My BITCOIN Act is currently the only viable solution that positions us to cut our national debt in half by 2045,” Senator Cynthia said in an interview with Bankless on Wednesday.
My BITCOIN Act is currently the only viable solution that positions us to cut our national debt in half by 2045. I joined @BanklessHQ to discuss how my commonsense legislation will get us back on track and secure our position as a world leader in financial innovation. https://t.co/CIYVscdsQh
— Senator Cynthia Lummis (@SenLummis) September 4, 2024
- According to Coinglass, Bitcoin’s long-to-short ratio is 0.95, at its lowest since August 28, meaning more traders anticipate the asset’s price to fall.
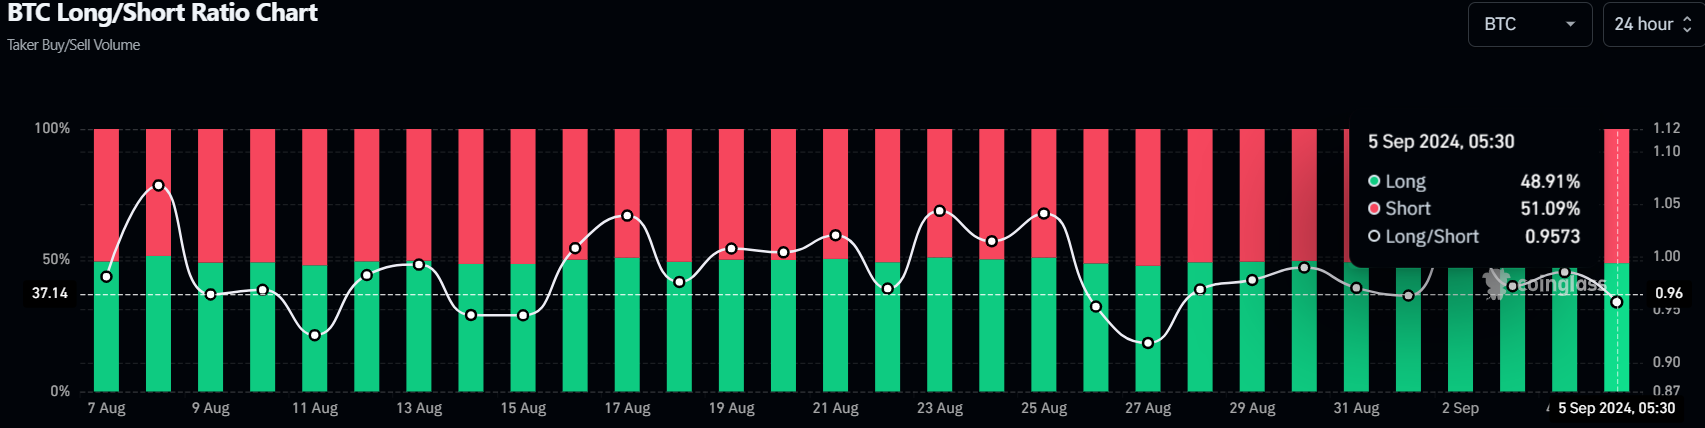
Bitcoin long-to-short ratio chart
- Santiment’s Daily Active Addresses index helps track network activity over time. A rise in the metric signals greater blockchain usage, while declining addresses point to lower demand for the network.
In BTC’s case, Daily Active Addresses fell from 836,960 on August 30 to 707,960 on Thursday, constantly decreasing since mid-March. This indicates that demand for BTC’s blockchain usage is decreasing, which could propel a decline in Bitcoin price.
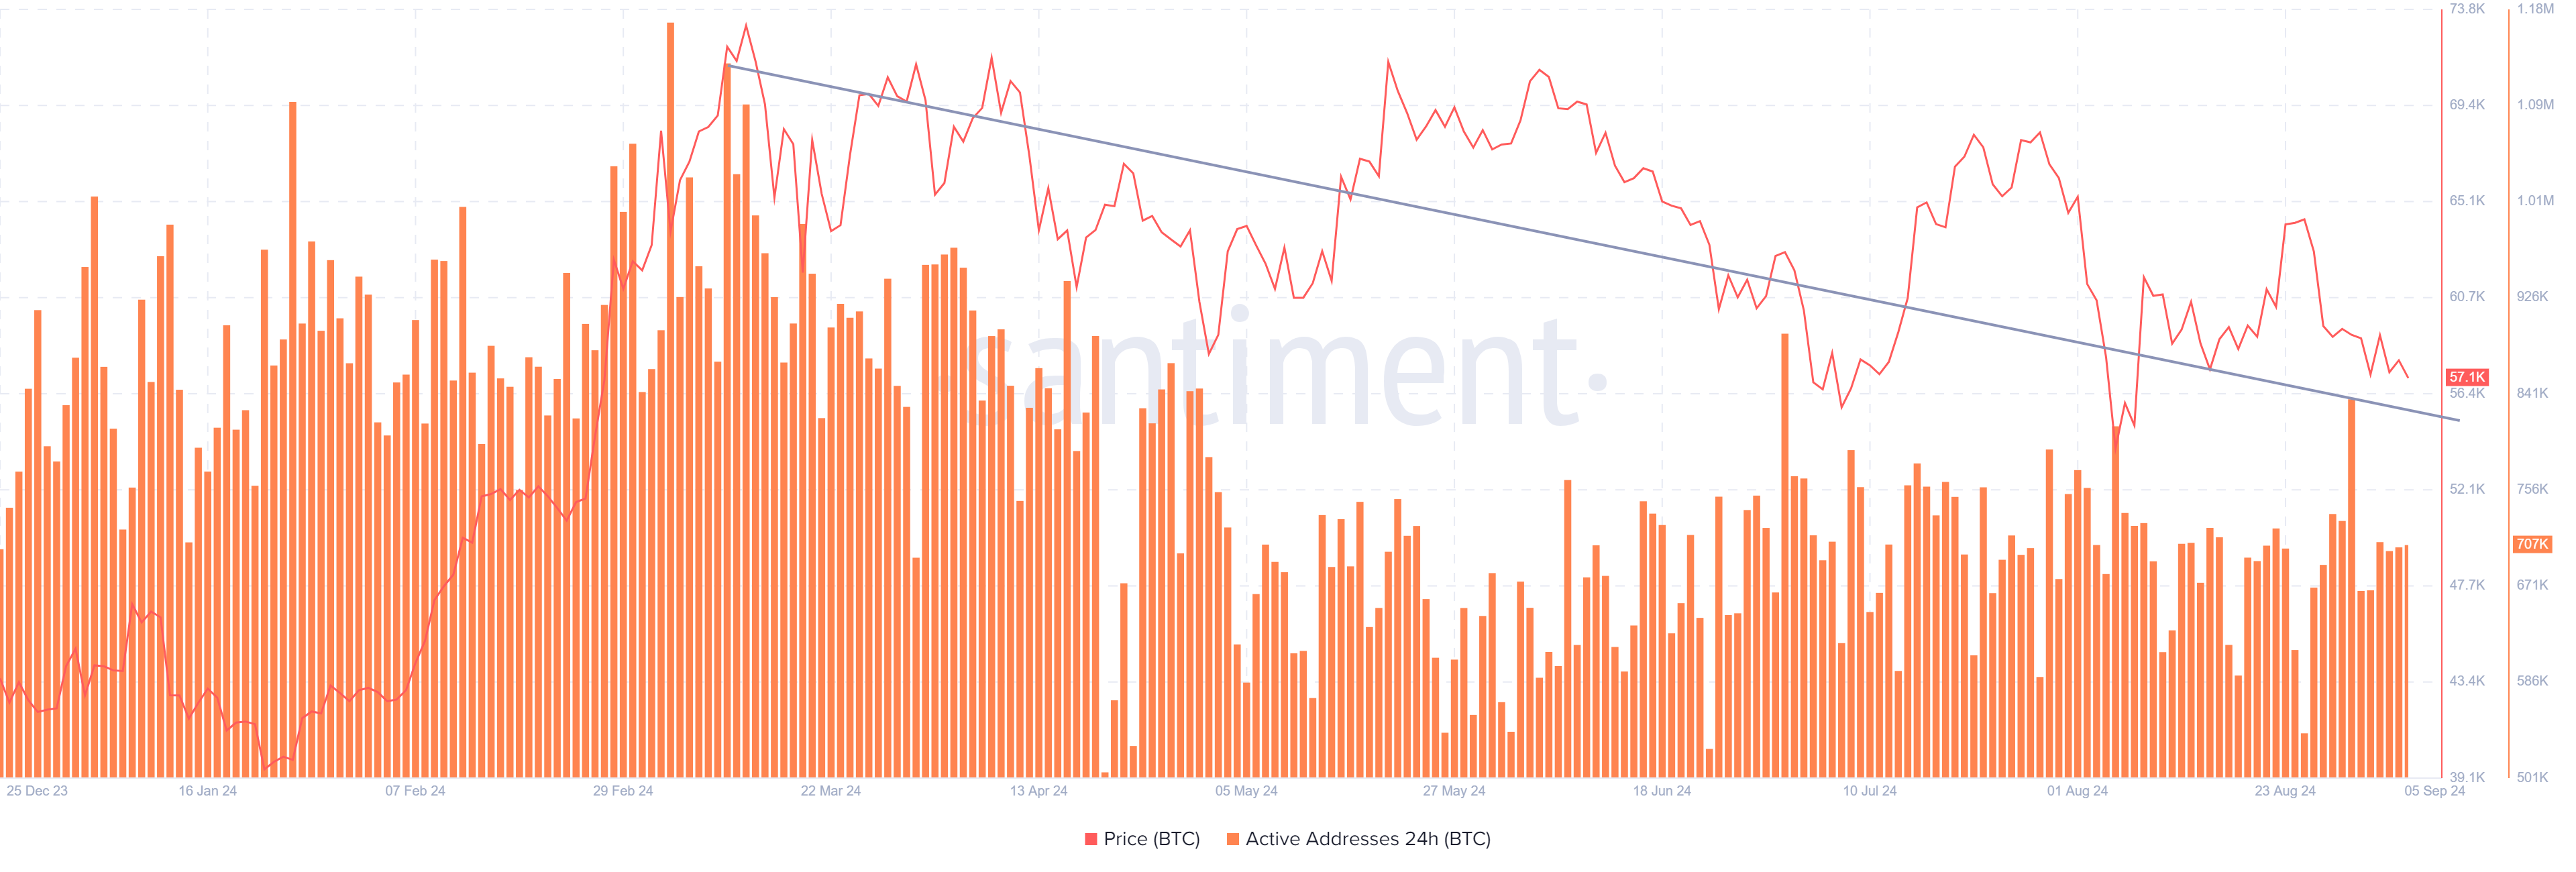
Bitcoin Daily Active Addresses chart
- CryptoQuant’s Bitcoin Coinbase Premium Index shows the gap between Coinbase Pro price (USD pair) and Binance price (USDT pair). Coinbase Premium data is one of the indicators that shows a sign of whale accumulation, as the Coinbase Pro platform is considered the gateway for institutional investors to purchase cryptocurrencies.
In the case of Bitcoin, the index has been declining since August 23 and fell from 0.0130 to 0.0001 from Monday to Wednesday, trading below its 14-day Simple Moving Average (SMA) at 0.0143. This indicates that whales are continuously selling at a lower premium. In addition, it shows a decrease in the interest and activeness of investors in Coinbase.
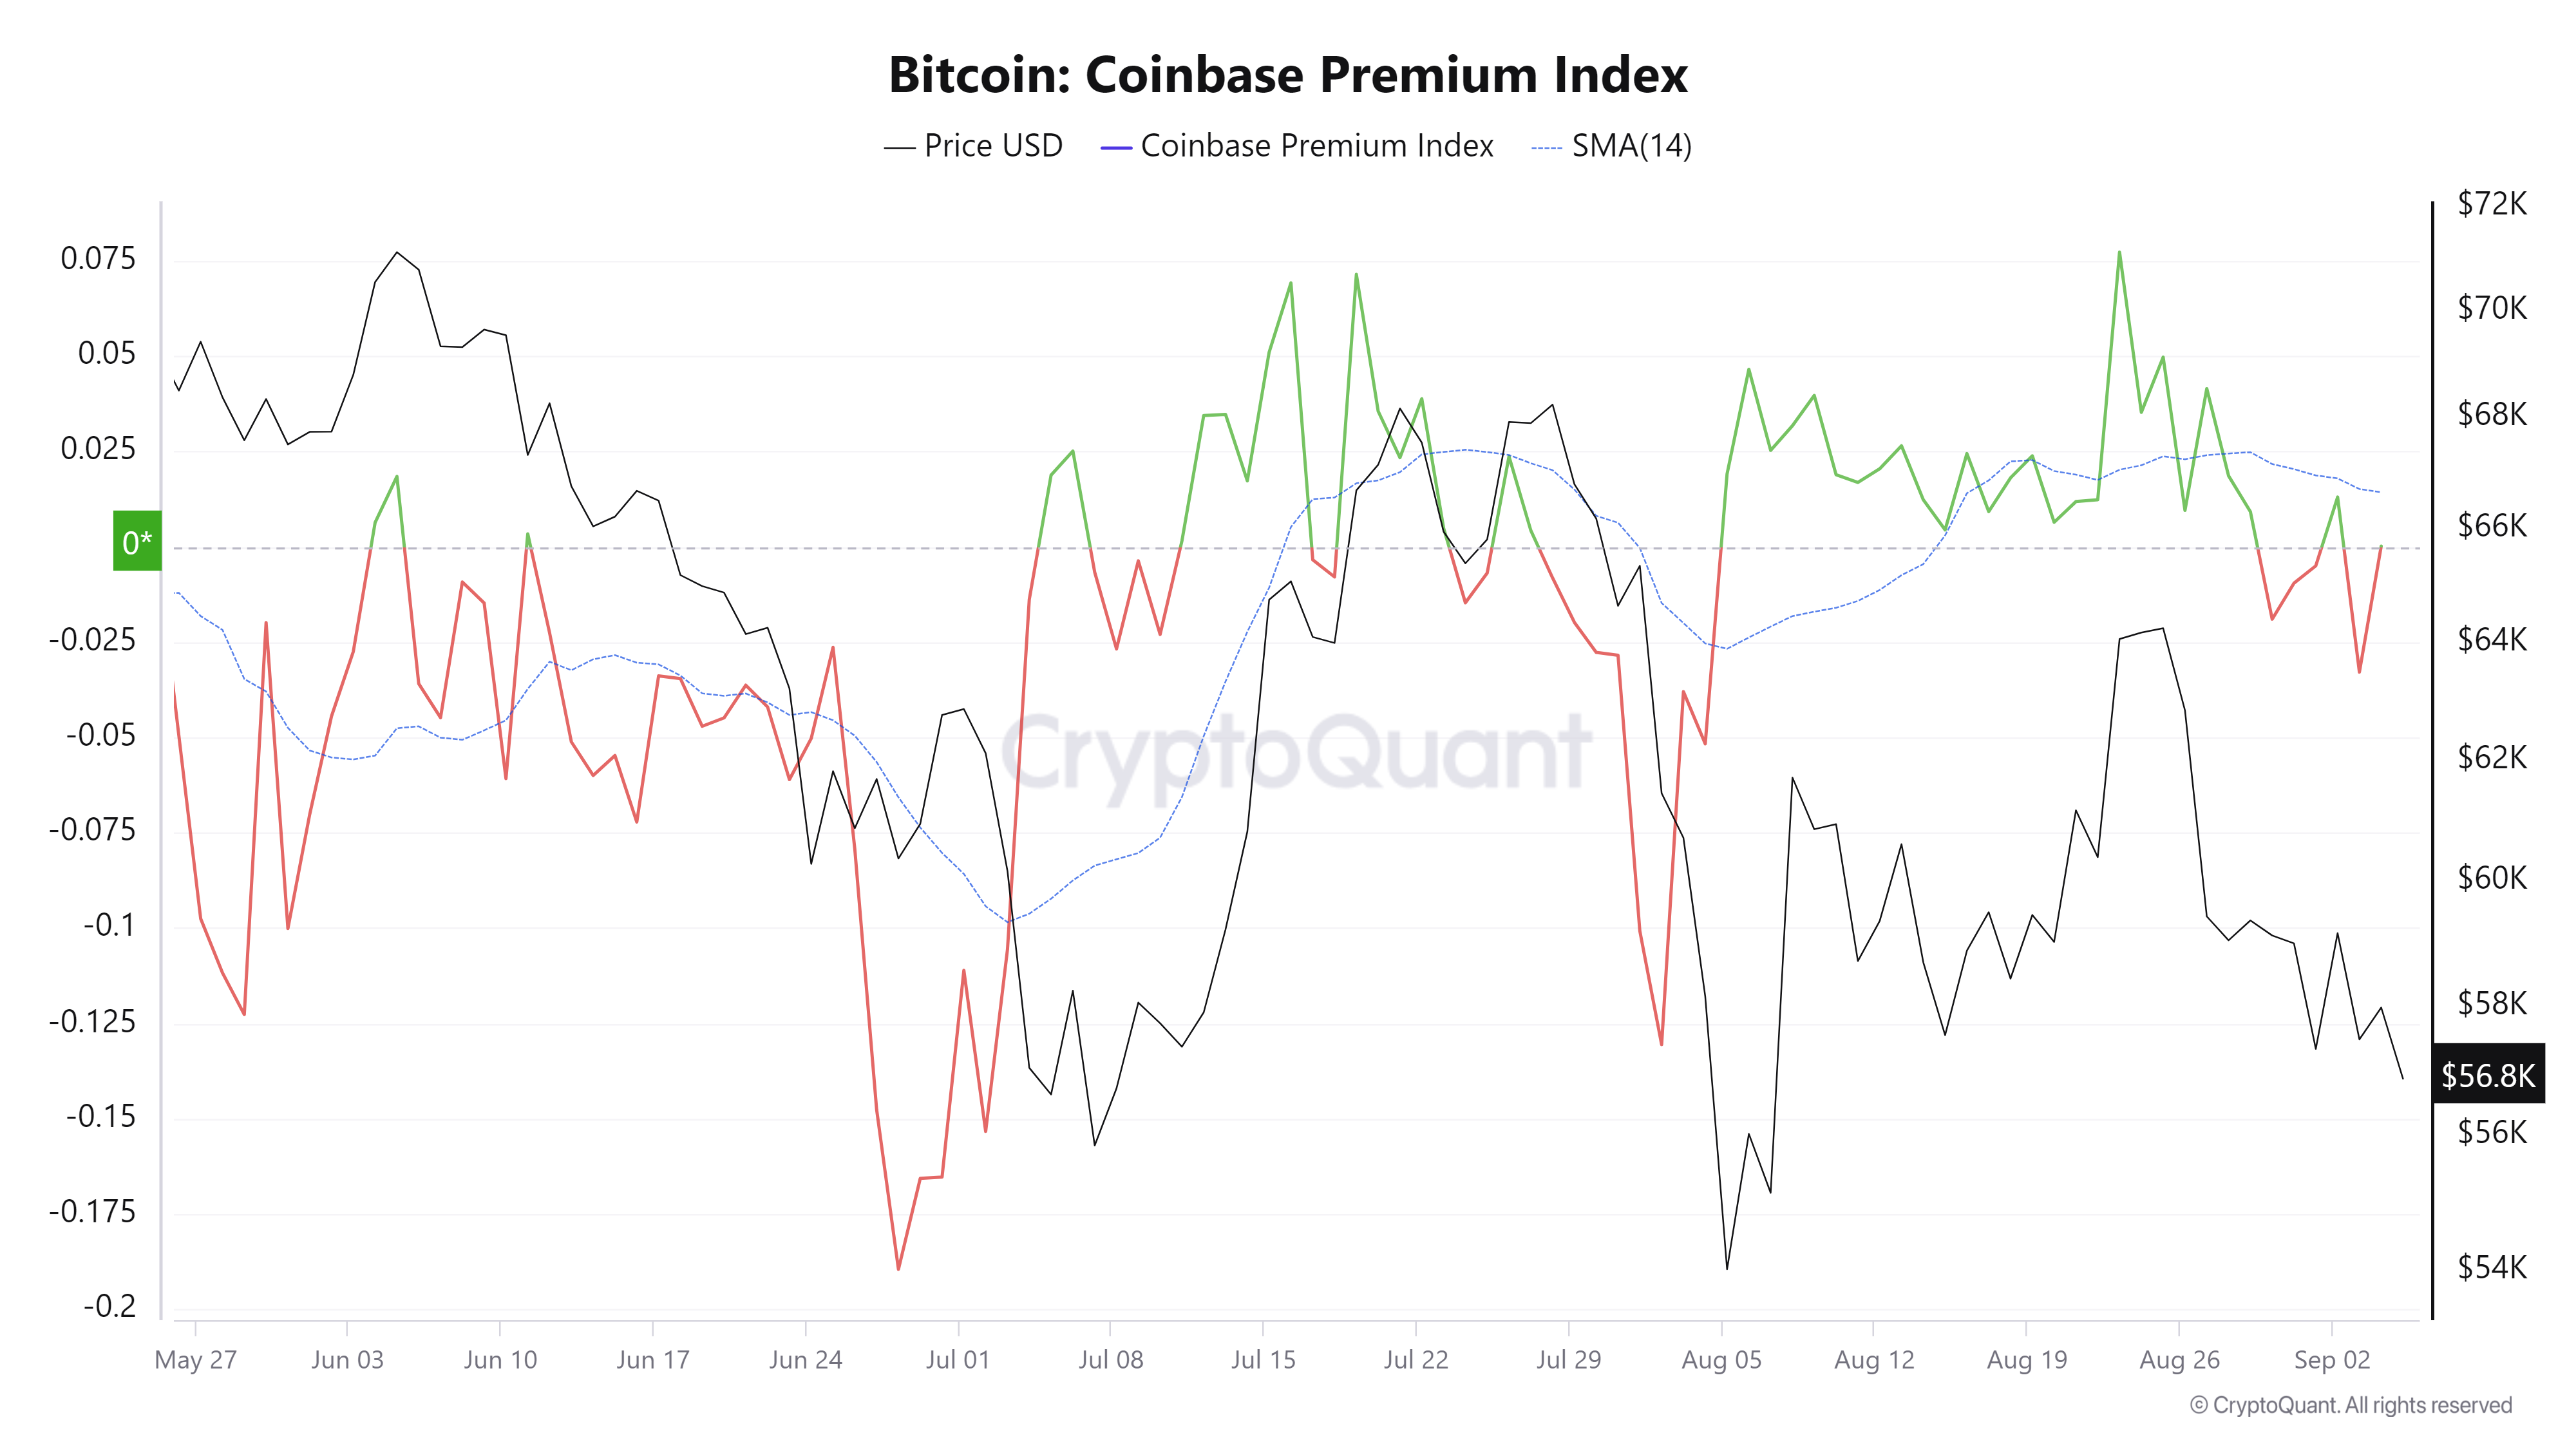
Bitcoin Coinbase Premium Index chart
BTC Technical analysis: BTC recovery could be short-lived
Bitcoin was rejected after retesting its 50% price retracement level at $59,560 (drawn from a high in late July to a low in early August) and dropped 2.78% on Tuesday. It bounced off on Wednesday after retesting the daily support level at $56,022, finally closing the day in the green near $58,000. However, this bounce could be short-lived, as it continues to decline by 2.15% at the time of writing to $56,725 on Thursday.
If BTC continues to decline and closes below the $56,022 daily support level, it could decline further by 3.5% to retest the psychological level of $54,000.
The Relative Strength Index (RSI) and the Awesome Oscillator (AO) momentum indicators on the daily chart trade below their respective neutral levels of 50 and zero, respectively. Both indicators suggest weak momentum and a continuation of its downward trend.
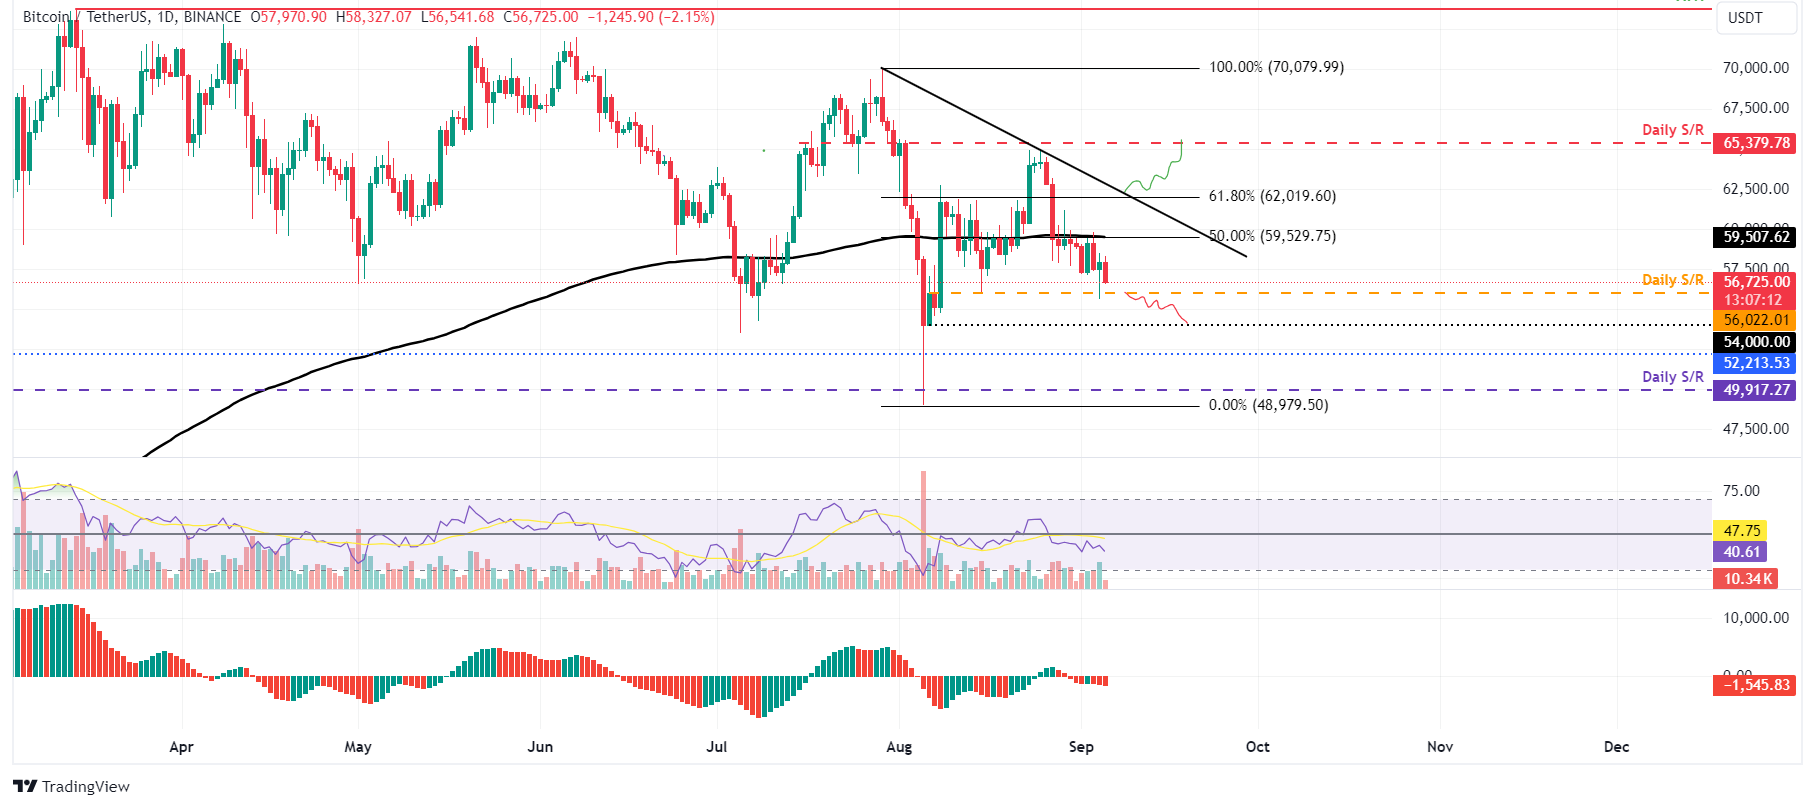
BTC/USDT daily chart
However, if Bitcoin’s price breaks above the $59,560 resistance and closes above $62,019, the 61.8% Fibonacci retracement level, the bearish thesis will be invalidated. In this scenario, BTC could extend the positive move by 5.5% to revisit its daily resistance level at $65,379.


