
Extremely Rare Golden Cross Appears on Bitcoin Price Chart: Details
 u.today 05 September 2024 15:34, UTC
 An extremely rare pattern has formed on the Bitcoin (BTC) price chart as the intersection of the 100 and 200 moving averages has created a golden cross on the chart. More importantly, this is the first such golden cross for a major cryptocurrency.
It is worth noting that when the 100 and 200 day moving averages cross, it is a significant event. These moving averages are key indicators used by traders to assess long-term trends.
The 100-day moving average shows the average closing price of Bitcoin over the past 100 days, while the 200-day moving average does the same for the past 200 days. When the shorter term crosses the longer term, it forms a golden cross, which is generally considered a bullish signal.
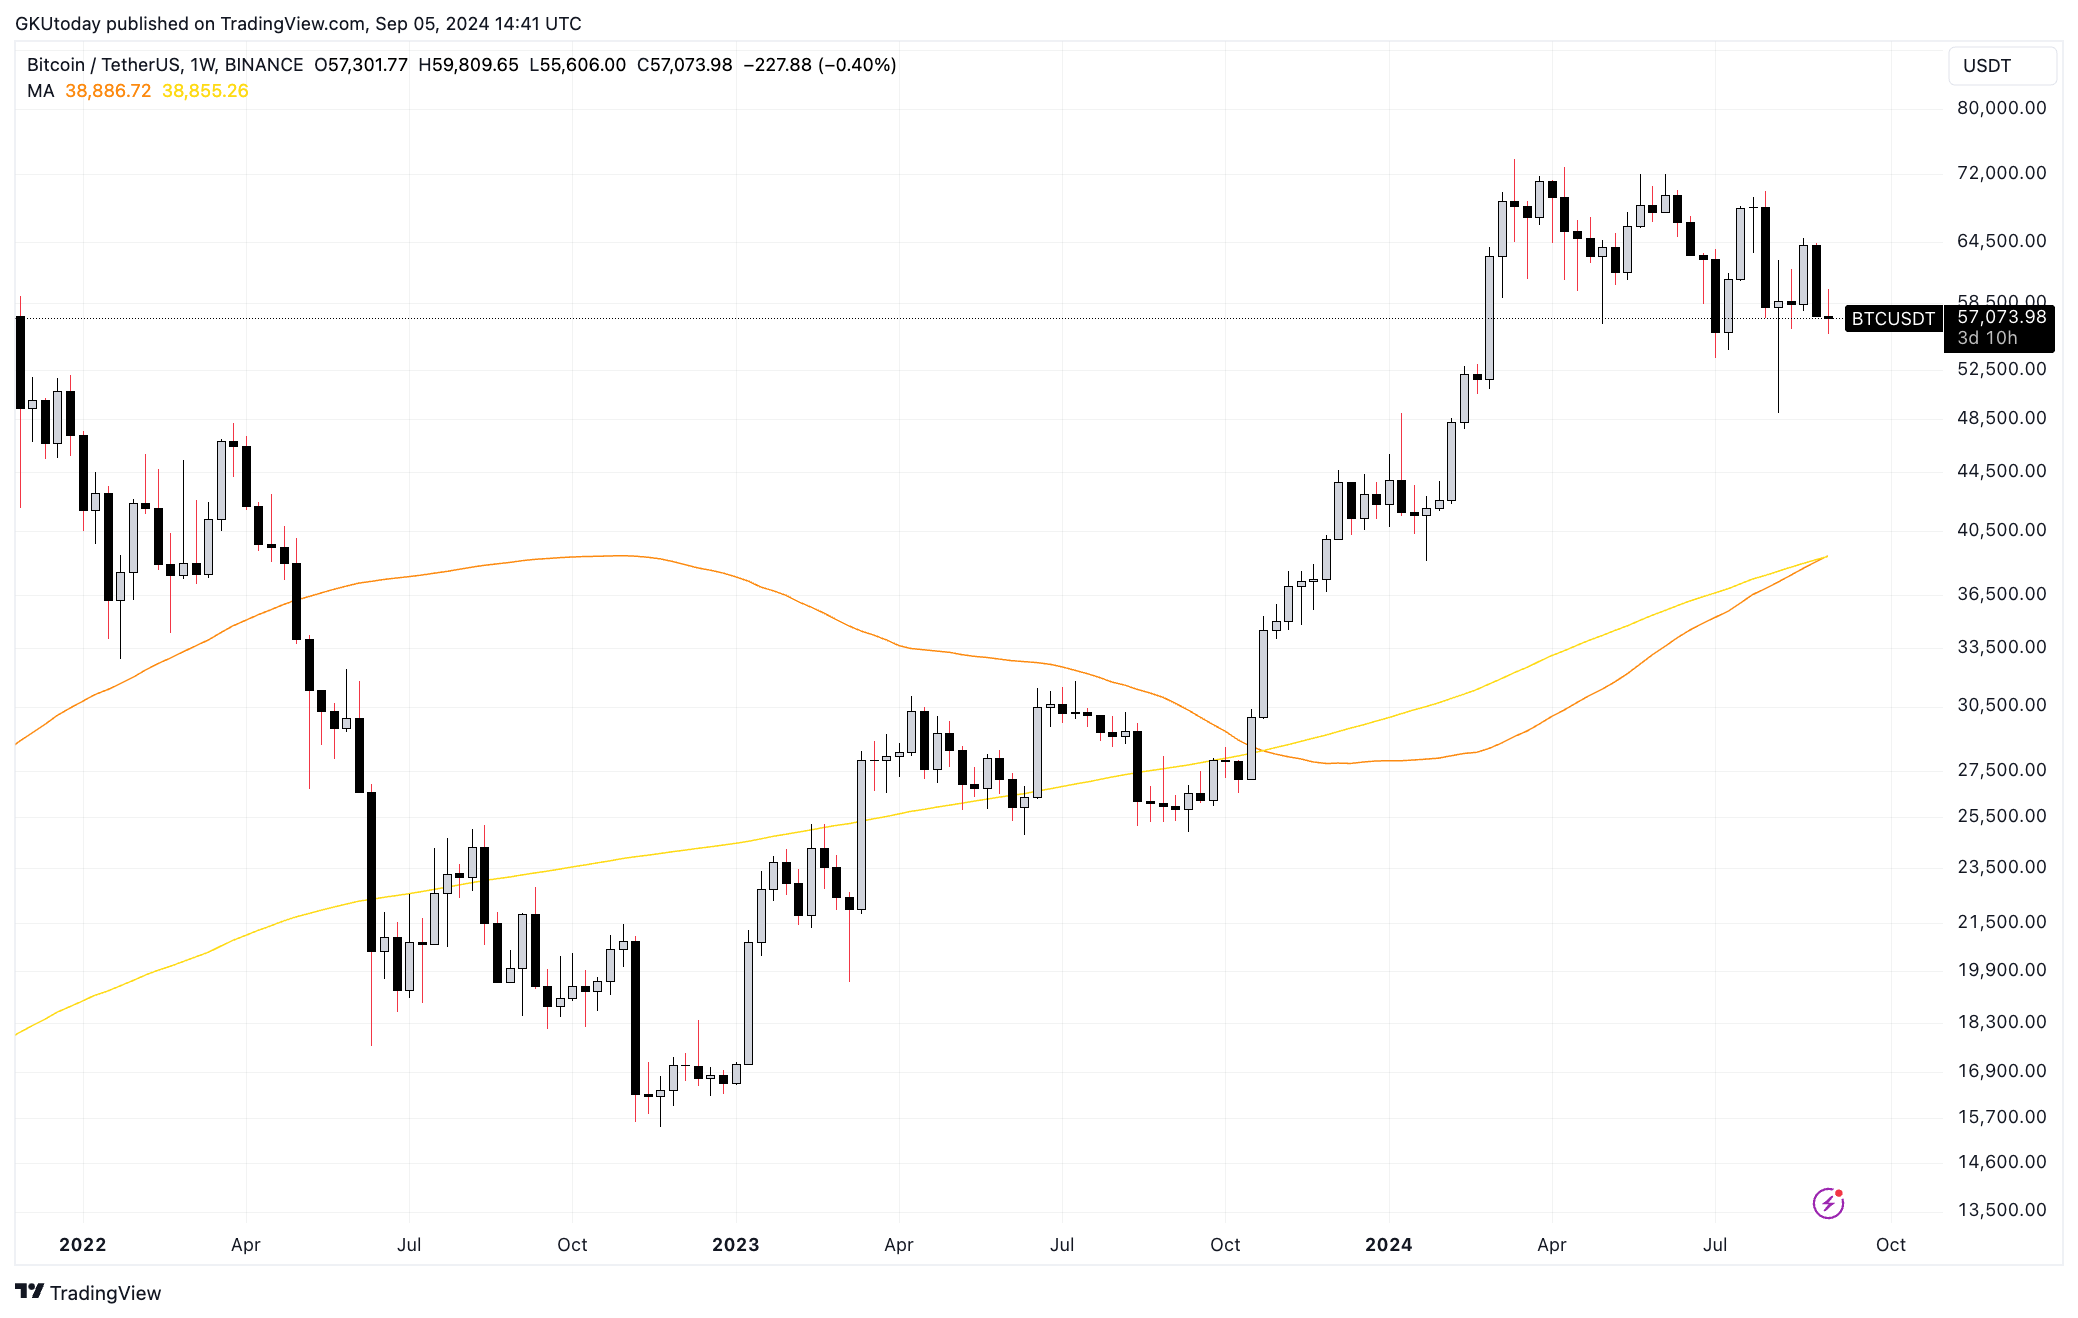
The golden cross indicates that Bitcoin’s price momentum may be shifting upward. This is because the shorter-term trend is now outpacing the longer-term trend. This pattern is often seen as a precursor to extended upward price movements. This is because it indicates growing market confidence and increasing demand for the asset.
But, there’s a but
However, it should be noted that these moving averages previously formed a death cross when the longer-term moving average crossed the shorter-term moving average. After this death cross was completed, the price of Bitcoin soared over 100% to a new all-time high of $74,000.
This means that if this golden cross plays out, we may not see a spike in the price of Bitcoin, but rather a further decline.
While the golden cross is a positive indicator, it is important to note that technical analysis is not foolproof. Other factors such as macroeconomic conditions, regulatory developments and investor sentiment can also influence the price of Bitcoin.


