
Chainlink’s Bearish Trends Intensify: 2 Key Indicators Signal Further Declines
 beincrypto.com 06 September 2024 10:43, UTC
 Chainlink (LINK) price has seen a significant drop recently, erasing most of the gains it made throughout August. After a period of growth, the altcoin has now fallen by 18% in just 12 days and is approaching a critical support level.
If the selling continues, it could put further pressure on LINK’s price. As it heads towards the support floor, investors are watching closely to determine if this trend will continue.
Chainlink Is Overwhelmed With Optimism
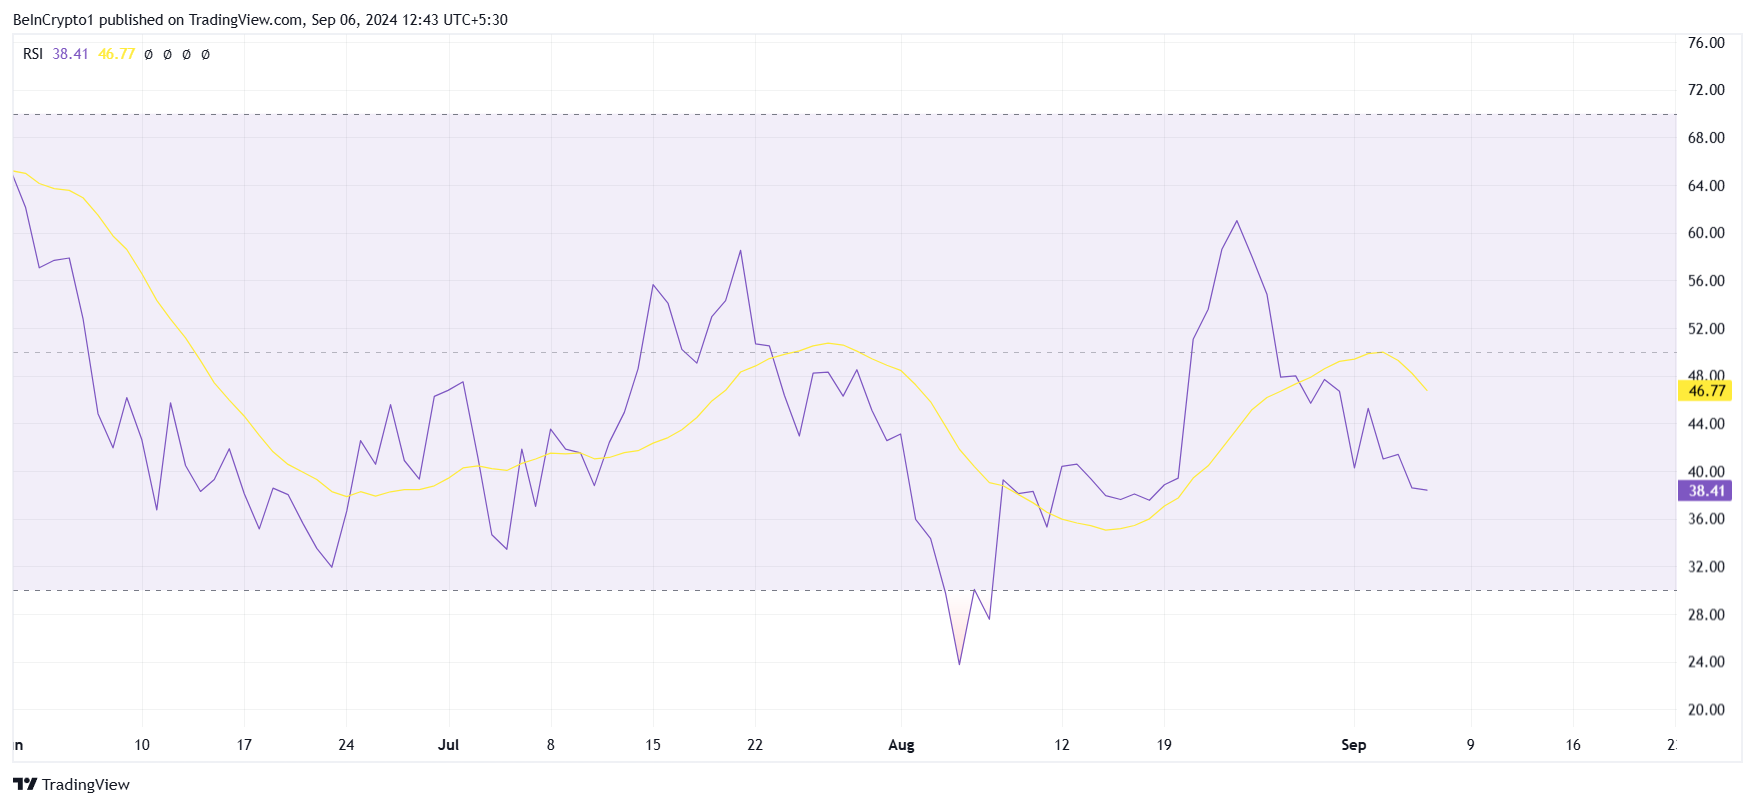
The macro momentum of Chainlink is currently bearish, as indicated by several key technical indicators. One such indicator, the Relative Strength Index (RSI), is experiencing a consistent downtick, pointing to growing selling pressure.
A decreasing RSI below the 50.0 level signals that bearish momentum is building. This continued decline could lead to increased selling activity, causing LINK’s price to drop further as the cryptocurrency market remains cautious.
The ongoing bearish sentiment, as reflected in the RSI, could push LINK toward even lower levels. Historically, an RSI below 30 can indicate that an asset is oversold, but at this stage, it still suggests that the selling pressure is not over. If the trend continues, this could result in a sharper decline for Chainlink, intensifying the current downturn.
Read More: How To Buy Chainlink (LINK) and Everything You Need To Know
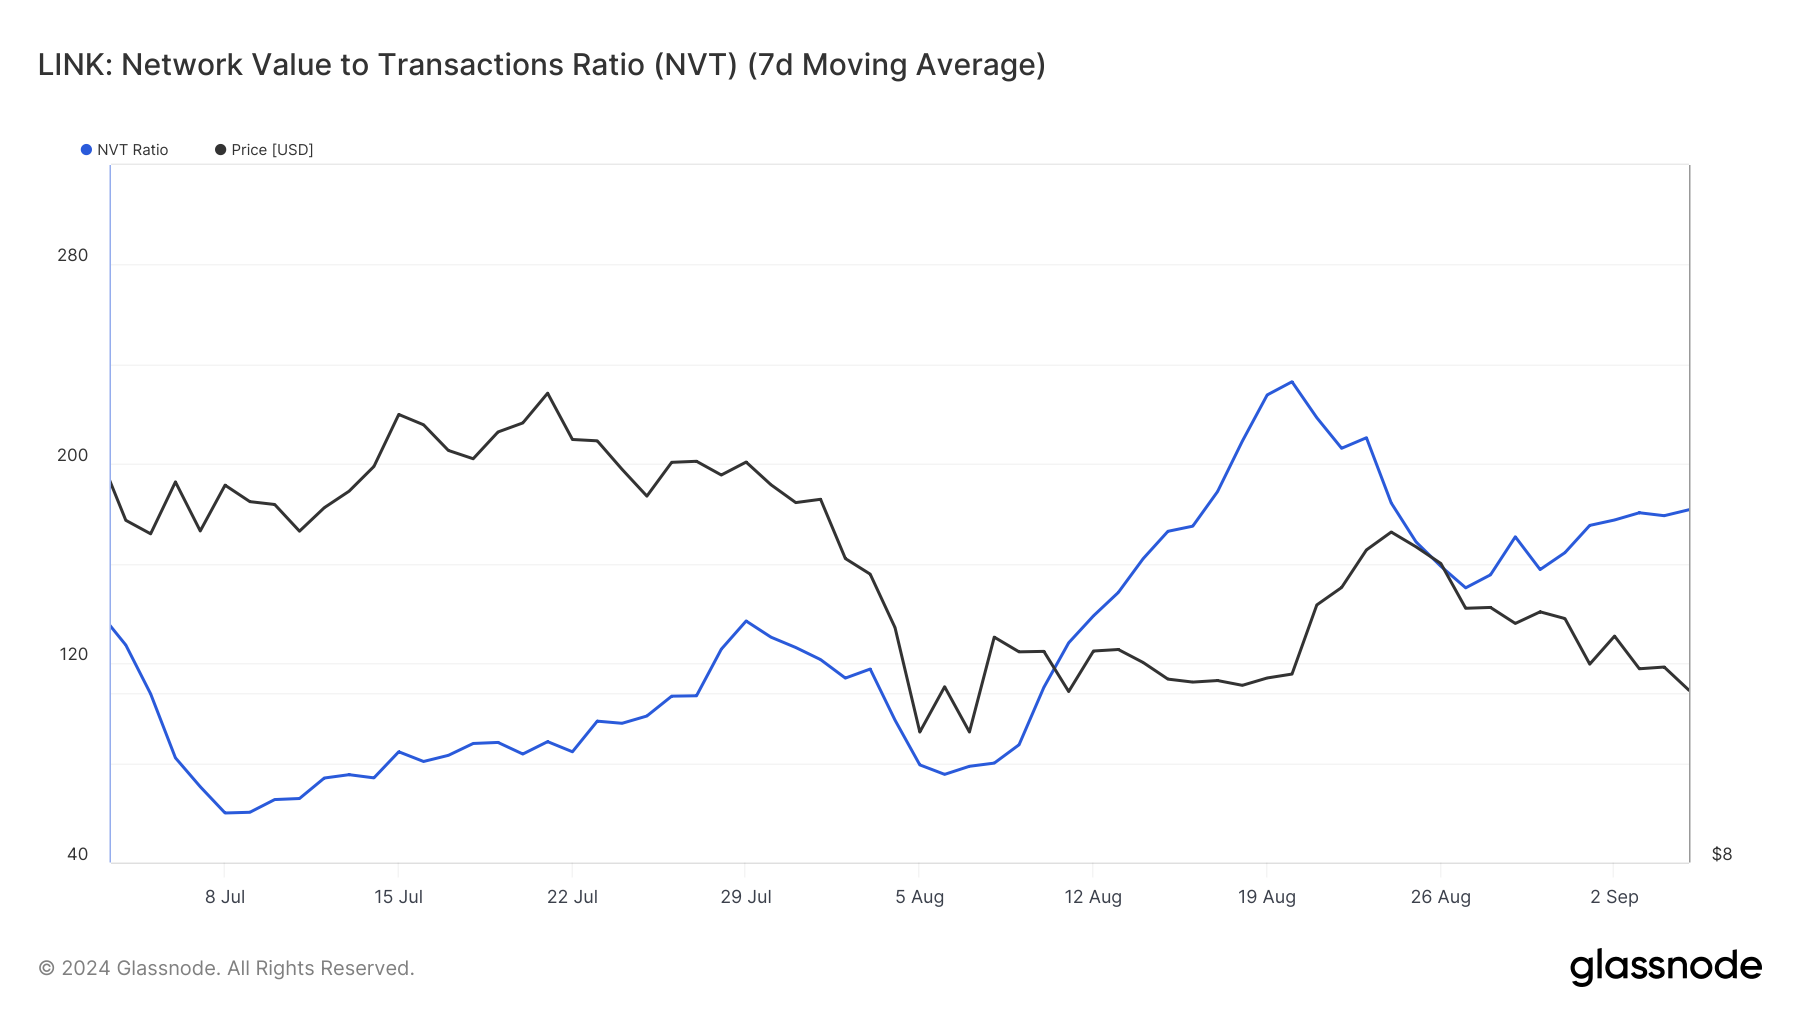
Chainlink’s Network Value to Transactions (NVT) ratio, which measures an asset’s market value against its network activity, further supports the bearish momentum. Currently, LINK’s NVT ratio is on the rise, indicating that the asset is overvalued relative to the network activity it is generating. This signals that the underlying fundamentals may not support the price, leading to a potential correction.
Interestingly, the decline in Chainlink’s price began just as the NVT ratio started to rise. This correlation suggests that investors’ optimism regarding LINK’s future does not align with its network activity. The disconnect between the rising price and falling network usage could be a warning sign for further declines as the market adjusts to the true value of the asset.
LINK Price Prediction: Slowing the Decline
Chainlink’s price has dropped by 18% in the last 12 days and is currently trading at $10.01. The coin has already fallen through its crucial support level of $10.79 and is now moving towards $9.35, a level that has previously acted as strong support. If the bearish trend continues, LINK could test this level again in the coming days.
Given the current market conditions, the continued overvaluation of Chainlink, and its decreasing RSI, it is likely that the price will see further declines. An asset that becomes overvalued often experiences a correction before finding stability. In this case, $9.35 may act as a firm support floor, holding off any deeper losses.
Read More: Chainlink (LINK) Price Prediction 2024/2025/2030
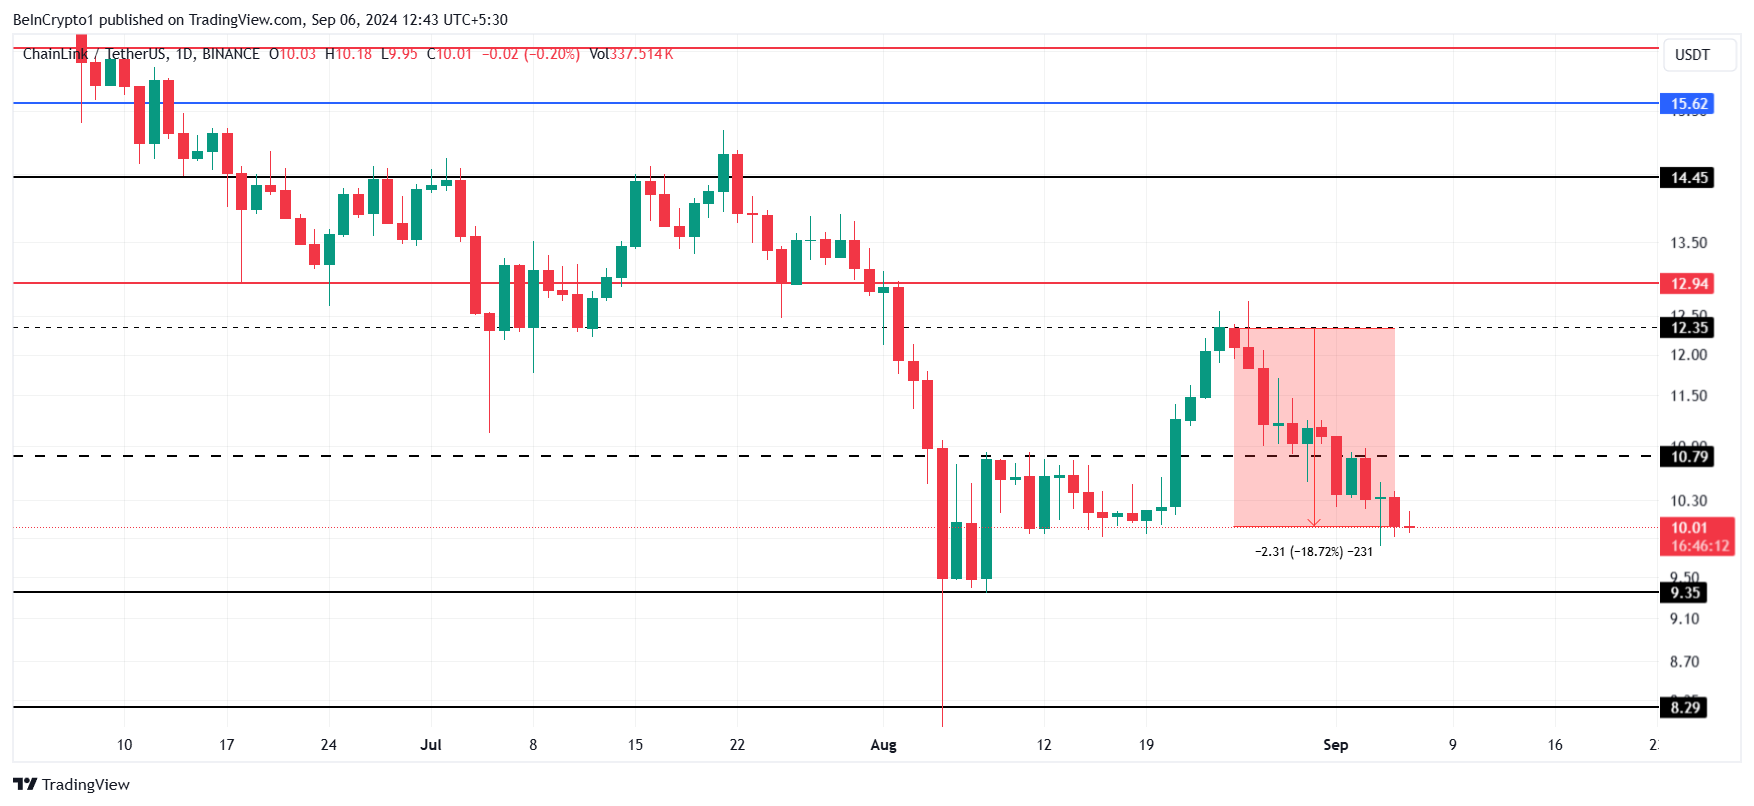
However, this bearish outlook could change if investors adjust their activity to match their sentiment. Should LINK manage to reclaim the $10.79 support level, the current downward trend could be reversed, potentially invalidating the bearish thesis and bringing some relief to investors.


