Daily Market Review: BTC, ETH, FET, POPCAT, FTM
The bulls are still in total control in today’s session, as seen from the increase in the global market cap. The total cap stood at $2.01T as of press time, representing a 2.7% increase over the last 24 hours, while the trading volume also jumped by 34% over the same period to stand at $49.05B as of press time.
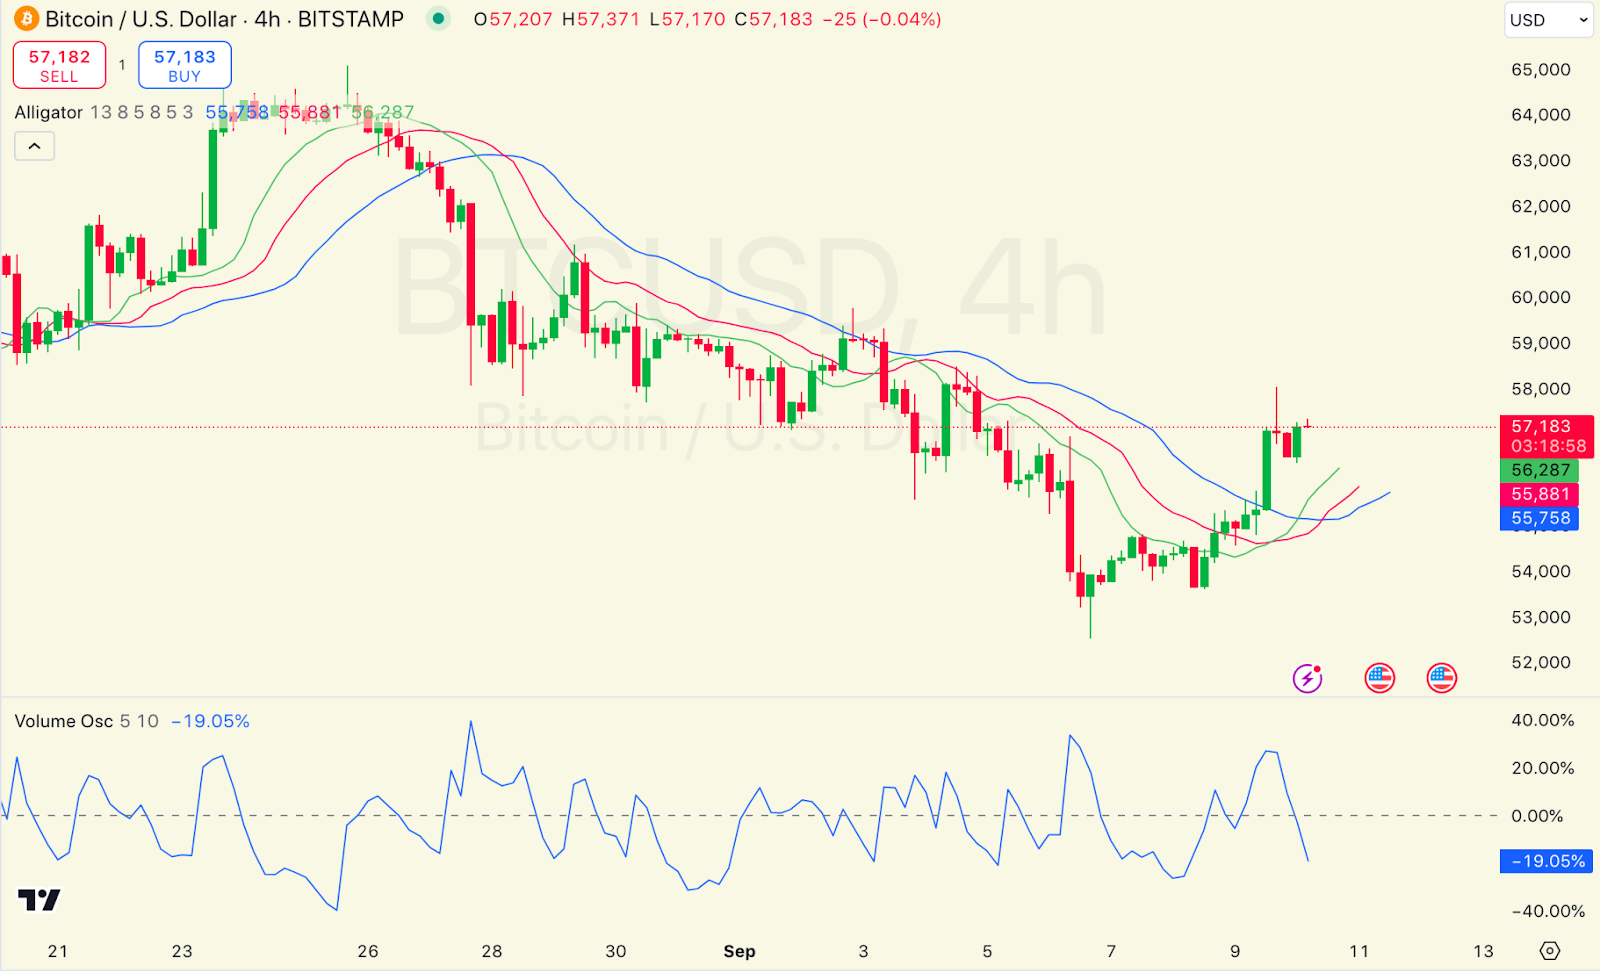
Bitcoin Price Review
Bitcoin, $BTC, has gained to post gains in today’s session, as seen from its price movements. Looking at an in-depth analysis, the Alligator lines (Jaw, Teeth, and Lips) are currently diverging after a period of convergence, signaling a possible reversal to an uptrend. The price is hovering slightly above the Lips (green line), suggesting a short-term bullish bias. However, the Lips and Teeth (red line) are quite close, indicating caution in upward momentum.
On the other hand, we see that the Volume Oscillator is showing a negative value of -19.05%, suggesting that buying interest has decreased, and volume momentum is weakening. Bitcoin traded at $56,987 as of press time, representing a 0.98% increase over the last 24 hours.
Ethereum Price Review
Ethereum, $ETH, has also gained in today’s session, as seen from its price movements. Looking at an in-depth analysis, Ethereum is currently trading near the mid-line of the Bollinger Bands (SMA 20) after bouncing off the lower band, indicating some buying interest. However, the price is still below the SMA, suggesting the potential for further downside unless it breaks above $2,368.
On the other hand, we see that the ADX (Average Directional Index): The ADX is at 21.60, which is relatively low, indicating a weak trend. This suggests that Ethereum may continue to consolidate in the current range between $2,244 and $2,368. Ethereum traded at $2,346 as of press time, representing a 0.92% increase over the last 24 hours.
Fetch.ai Price Review
Fetch.ai, FET, has also gained in today’s session, as seen from its price movements. Looking at an in-depth analysis, we see that Fetch.AI is showing strong bullish momentum, with the price moving above the Ichimoku Cloud and the Tenkan-sen (blue line) above the Kijun-sen (red line). This bullish crossover suggests that buying momentum is strong.
On the other hand, we see that the Awesome Oscillator is displaying a bullish histogram, further reinforcing upward momentum. Green bars indicate that the bulls are currently in control. Fetch.ai traded at $1.26 as of press time, representing a 9% increase over the last 24 hours.
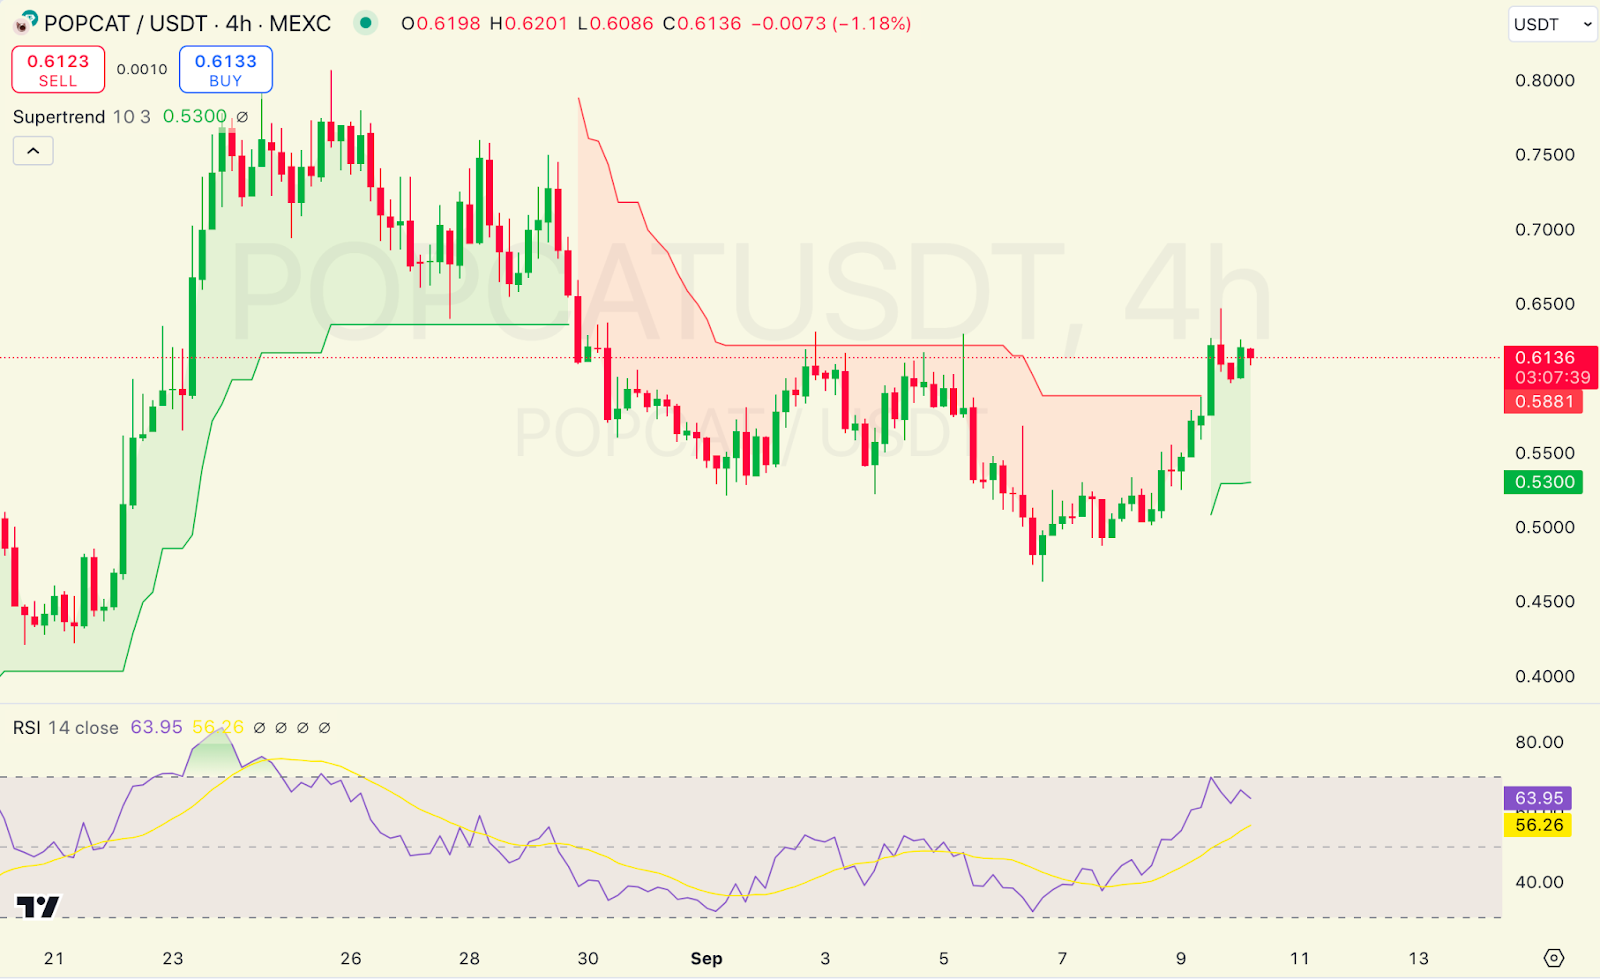
Popcat Price Review
Popcat, $POPCAT, is also among the gainers in today’s session as seen from its price movements. Looking at an in-depth analysis, we see that the Supertrend indicator has recently turned bullish, with the price holding above the support level of $0.53. However, the price is still near the resistance area of $0.61, which may act as a strong barrier.
On the other hand, we see that the RSI (Relative Strength Index): The RSI is hovering at 56, suggesting that momentum is moderately bullish but not overbought, allowing for further upward movement if buying pressure continues. Popcat traded at $0.6055 as of press time, representing a 4.9% increase over the last 24 hours.
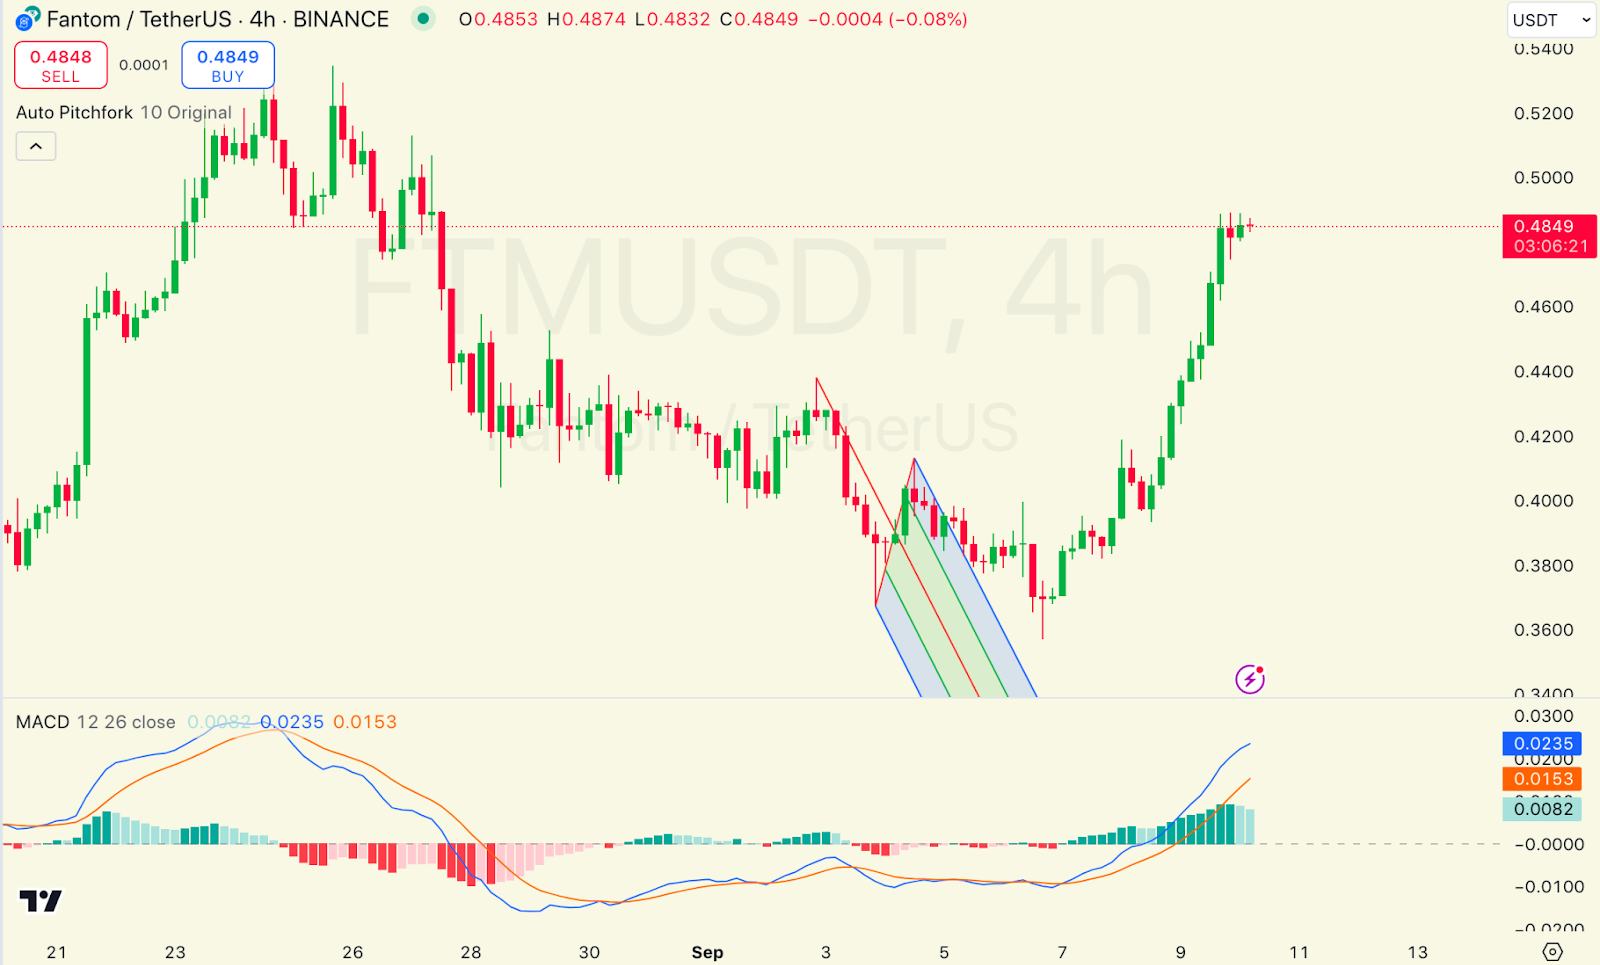
Fantom Price Review
Fantom, $FTM, is also among the gainers in today’s session as seen from its price movements. Looking at an in-depth analysis, we see that the MACD shows a recent bullish crossover, with the MACD line crossing above the signal line. The histogram is printing positive values, suggesting bullish momentum is gaining strength. The price has recently surged, breaking past $0.48.
On the other hand, we see that the MACD showing positive momentum, Fantom could continue its upward push towards $0.50. However, if the price is rejected at this resistance, it may pull back to $0.46 for a retest. Fantom traded at $0.4826 as of press time, representing a 7.9% increase over the last 24 hours.