Bitcoin Price Today: After 118% Surge, What’s Next for BTC Price in 2024?
 coinpedia.org 11 September 2024 08:49, UTC
 Over the last year, Bitcoin has witnessed an impressive increase of 118.2%. At the beginning of the year, the price was around $42,280. Currently, it stands at $56,318. This year, the market has shown a rise of at least 33.7%. Let’s see what this year’s BTC price action conveys.
Bitcoin Price Action: A General Overview
Between late January and mid-March, the Bitcoin market experienced the most powerful upward momentum of the year. By the end of this period, the price touched the yearly peak of $73,682. Later, the market started to move sideways, ranging between $71,500 and $52,000. In April, it reported a change of -14.75. In May and July, it recorded positive changes of +11.1% and +3.09%, respectively, while in June and August, the market registered negative changes of -7.02% and -8.73%, respectively. At the beginning of this month, the price was nearly $57,290. On September 6, it plummeted to the monthly lowest of $53,905. In the last few days, the market showed a small sign of recovery. Last day, it was lifted to the range of $57,601. However, what we see now in the one-day chart of Bitcoin is not impressive: the price seems to be falling again.
Bitcoin Yearly & Quarterly Price Analysis
In the previous year, the market recorded a change of over +155.4%. Since 2011, only thrice has the market shown a negative yearly change. In 2014, 2018, and 2022, the market reported -57.6%, -73.3%, -64.3% yearly changes, respectively. The highest-ever yearly change was reported on 2013, when the market displayed a change of +5,435%.
Though in the first quarter of the year the market demonstrated an impressive change of +68.7%, in the second and third quarters, it disappointed us with -12% and -10.3% changes, respectively. Historically, Q3 has been unfavorable for Bitcoin. In the last decade, only four times has the market recorded a positive change in Q3. However, the historic trend looks favorable for Q4, as in the last decade, the market reported a positive change in Q4 at least six times.
Bitcoin Technical Analysis
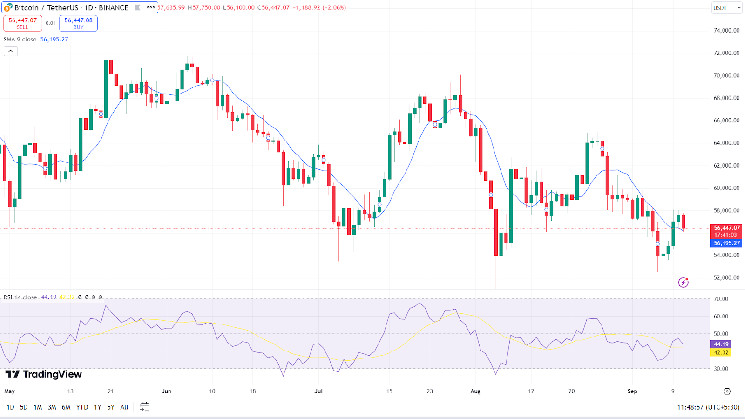
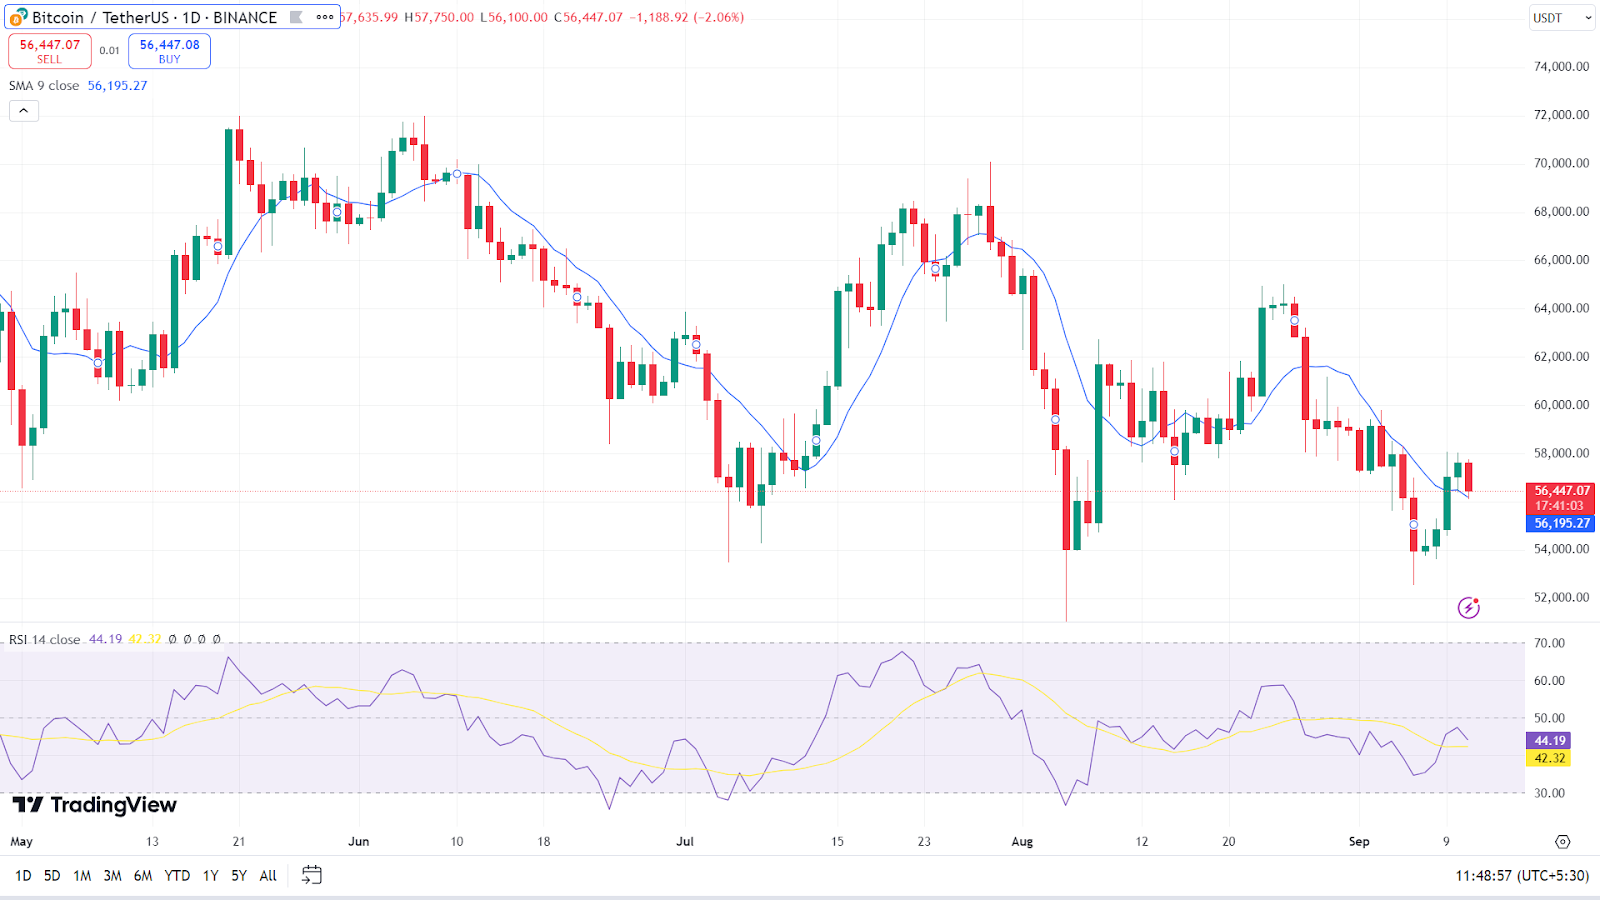
At present, the Bitcoin RSI stands at 44.03, which indicates the market is in the over-brought region. It was on August 26 that the market slipped below the 50-level of RSI.
The 50-day SMA remains at $60,242 – far higher than the present price range. The 100-day SMA is $61,997, and 200-day SMA is $63,942.

The BTC price broke the 9-day SMA on September 9. At peasant, the value of the 9-day SMA is 56,193.13. The current price of Bitcoin is slightly above the SMA, but is very close to it.
In conclusion, there is a high expectation that the Bitcoin market is likely to witness strong positive momentum in the final quarter of 2024. The interesting thing is that the data also slightly favours the expectation.
Read Also : Why Bitcoin Spot ETFs Are Dominating Over Ethereum ETF on Wall Street?


