
Solana’s Active Addresses Hit 4-Year High: What’s Driving It?
 coinedition.com 11 September 2024 10:34, UTC
 Solana is defying the current crypto market slowdown. While its native token SOL might be struggling to maintain its price, the blockchain itself is witnessing a surge in activity, reaching a four-year high in daily active addresses.
This significant increase, highlighted in a chart shared on X (formerly Twitter), puts Solana ahead of other major blockchain networks like Tron, Avalanche, Aptos, and Polygon.
BREAKING: SOLANA RECORDS HIGHEST DAILY ACTIVE ADDRESSES IN BLOCKCHAIN HISTORY pic.twitter.com/6aY3PTbCV6
— DEGEN NEWS (@DegenerateNews) September 10, 2024
Read also: Solana’s Active Addresses Hit 4-Year High: What’s Driving It?
The supporters of Solana celebrated the milestone on X, with one user stating that Solana is the
endgame” and other blockchain networks are “scams.” The chart from Artemis, an on-chain fundamentals platform, showed that in August 2024, the daily active addresses on the Solana blockchain skyrocketed.
Meme Coin Craze Fuels Network Growth
As of September 9, the number of daily active addresses on Solana stands at 5.4 million; on Tron stands at 2.1 million; and on Near Protocol (NEAR) stands at 2.9 million. Meanwhile, Base and Polygon PoS recorded 1.1 million and 606K daily active addresses.
Read also: Pantera’s $1B Crypto Fund: A Solana-Focused Bet?
Active addresses on Tron and Solana are on the rise because of meme coin platforms SunPump and pump.fun on these blockchains respectively. The activity on Tron has been on the rise following the debut of SunPump and the network even led blockchain revenues in August 2024, earning $60.9 million.
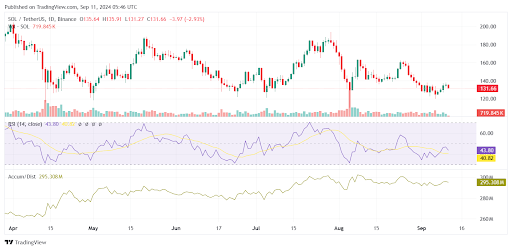
According to the data from CoinMarketCap, the SOL token is down 1.66% in the past 24 hours and is trading at $131.72 at the time of writing. The trading volume of the altcoin dipped 22.55% to $1.82 billion and the market capitalization of the digital asset is $61.62 billion.
” crossorigin=”anonymous”>
As per the chart from TradingView above, the accumulation of the SOL token remains on the rise while the Relative Strength Index (RSI) reads a value above 43.80 which means that the sellers are in charge of the market. Further, the gradient of the line suggests that lower prices will follow in the short term.
Disclaimer: The information presented in this article is for informational and educational purposes only. The article does not constitute financial advice or advice of any kind. Coin Edition is not responsible for any losses incurred as a result of the utilization of content, products, or services mentioned. Readers are advised to exercise caution before taking any action related to the company.


