Daily Market Review: BTC, ETH, ICP, AAVE, FET
The bears are still in total control in today’s session, as seen from the increase in the global market cap. The total cap stood at $1.99T as of press time, representing a 0.66% decrease over the last 24 hours, while the trading volume also dropped by 6.3% over the same period to stand at $63.52B as of press time.
Bitcoin Price Review
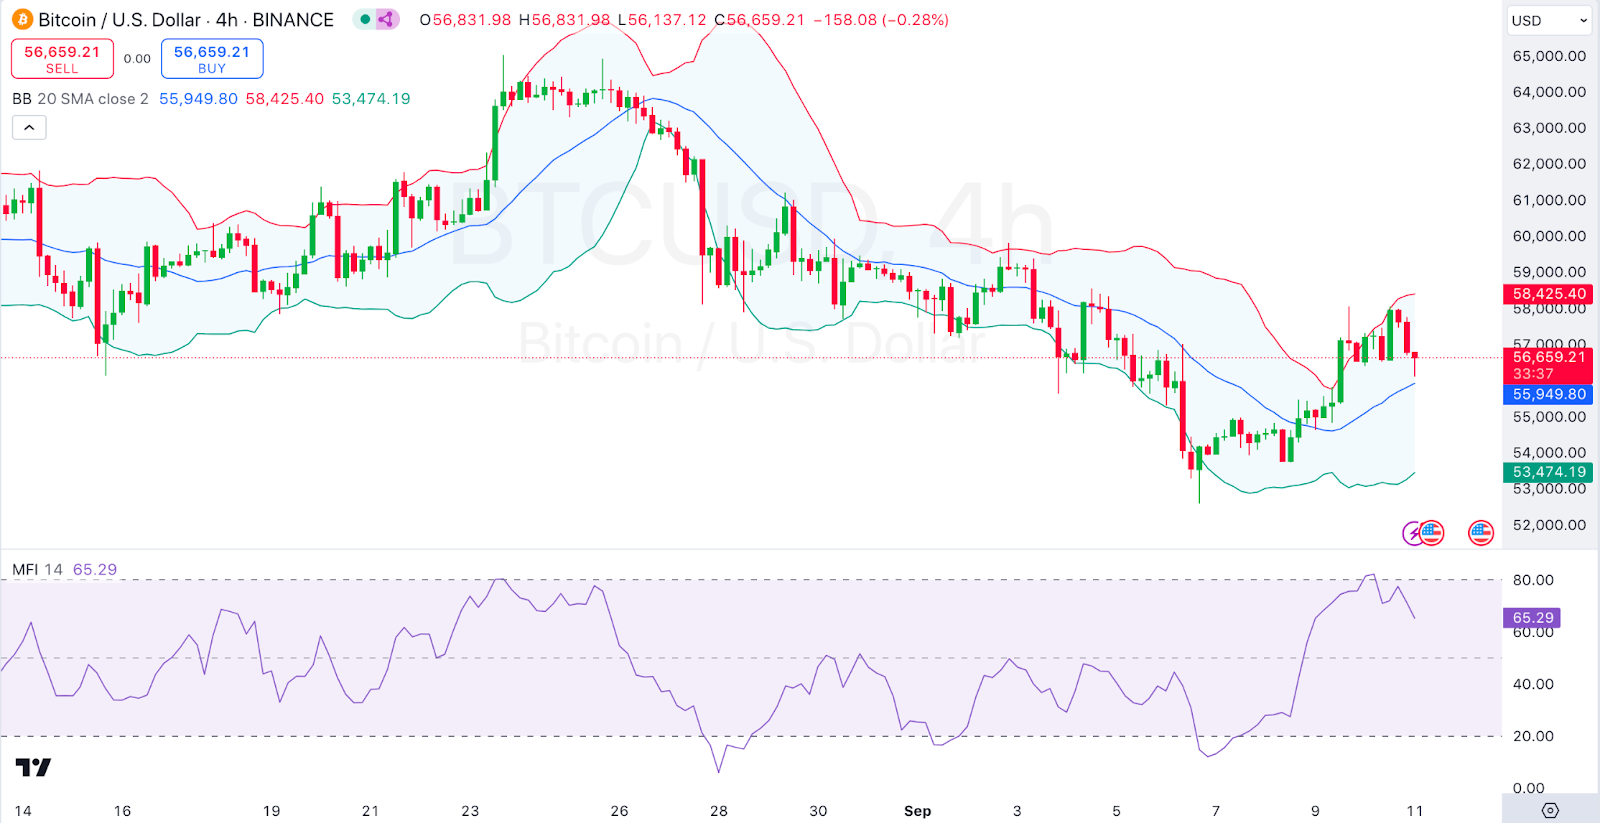
Bitcoin, $BTC, has failed to post gains in today’s session, as seen from its price movements. Looking at an in-depth analysis, we see that Bitcoin’s price is fluctuating within the Bollinger Bands, which have started to widen, indicating rising volatility. The price is approaching the lower band, suggesting a potential retest of support near $55,949.80.
On the other hand, we see that the MFI (Money Flow Index) at 65.29 suggests that the market is approaching overbought territory, which could signal a possible short-term correction before any further upside. Bitcoin traded at $56,623 as of press time, representing a 1% decrease over the last 24 hours.
Ethereum Price Review
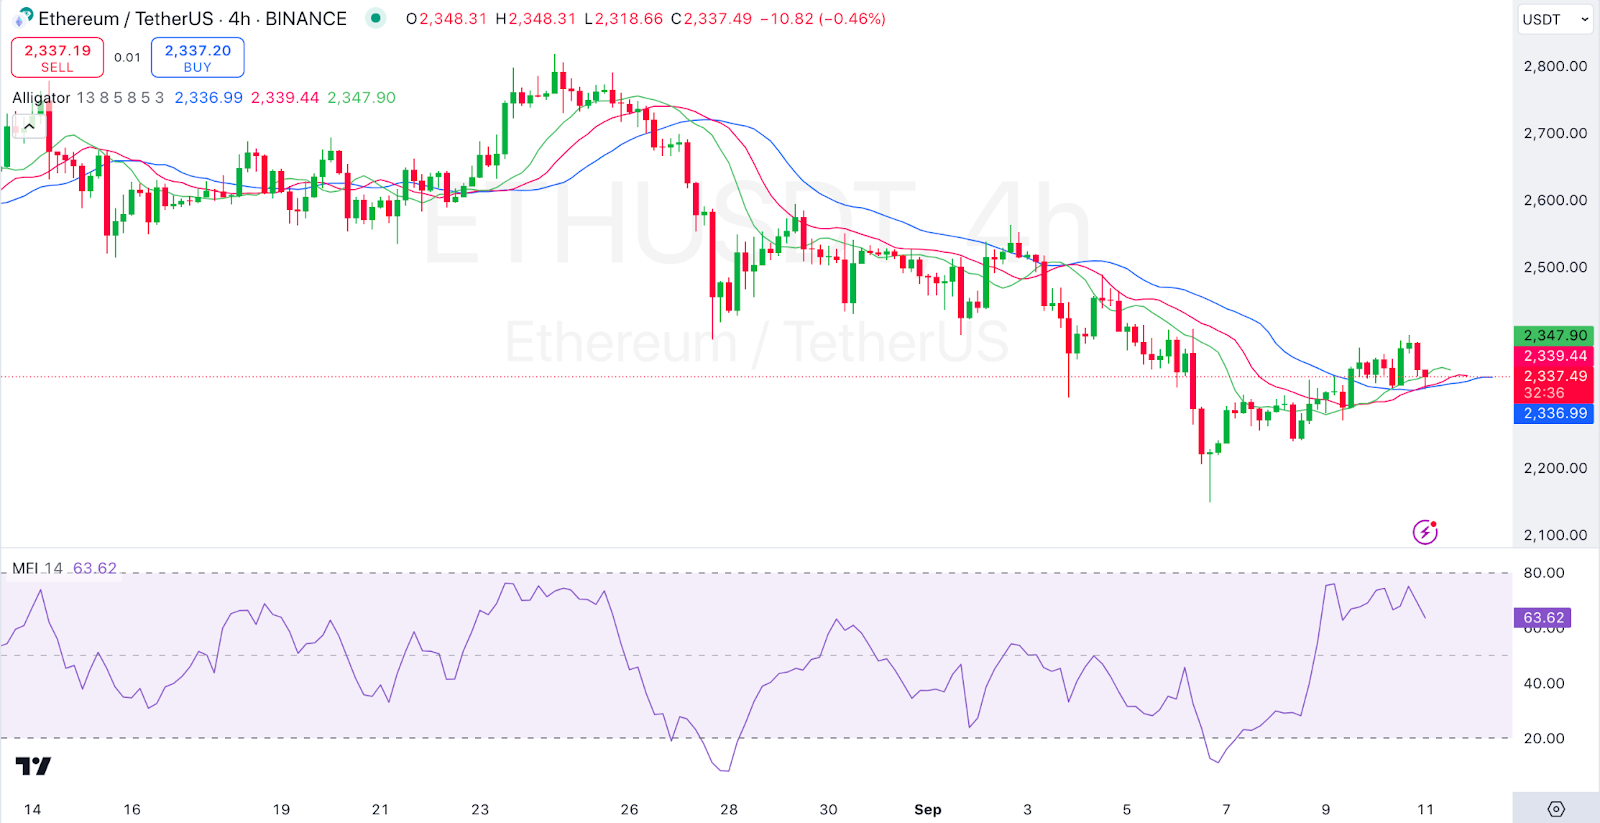
Ethereum, $ETH, has also failed to post gains in today’s session, as seen from its price movements. Looking at an in-depth analysis, we see that the Ethereum’s price has been consolidating, with the Alligator lines converging, indicating a lack of strong momentum and the possibility of a trend reversal. The current price is moving in a tight range, close to the Alligator’s balance lines, implying the market is awaiting further direction.
On the other hand, we see that the MFI is at 63.62, suggesting a moderately strong buying pressure but not yet overbought. Further upside is possible if the current consolidation breaks to the upside. Ethereum traded at $2,337 as of press time, representing a 0.95% decrease over the last 24 hours.
Internet Computer Price Review
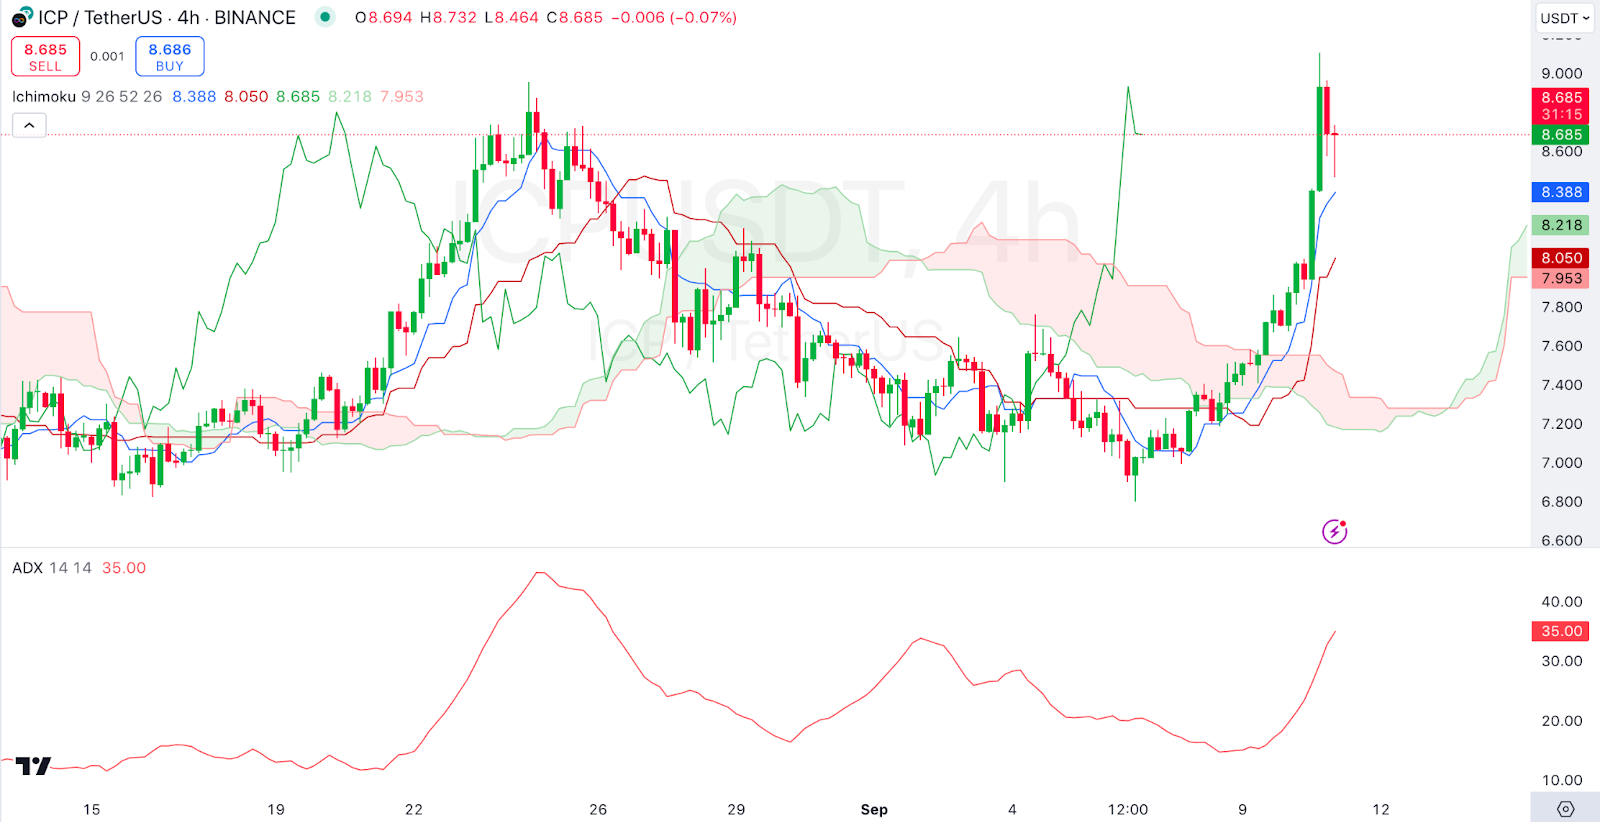
Internet Computer, $ICP, is among the top gainers in today’s session, as seen from its price movements. Looking at an in-depth analysis, ICP is trading above the cloud, suggesting a bullish trend in play. However, the price recently pulled back after a sharp rally, and the future cloud is thinning, hinting at potential consolidation or a slowdown in bullish momentum.
On the other hand, we see that the ADX (Average Directional Index) at 35.00 signals a moderately strong trend, confirming that ICP has had a solid bullish phase, though the trend might start weakening without further support. Internet Computer traded at $8.71 as of press time, representing a 11.15% increase over the last 24 hours.
Aave Price Review
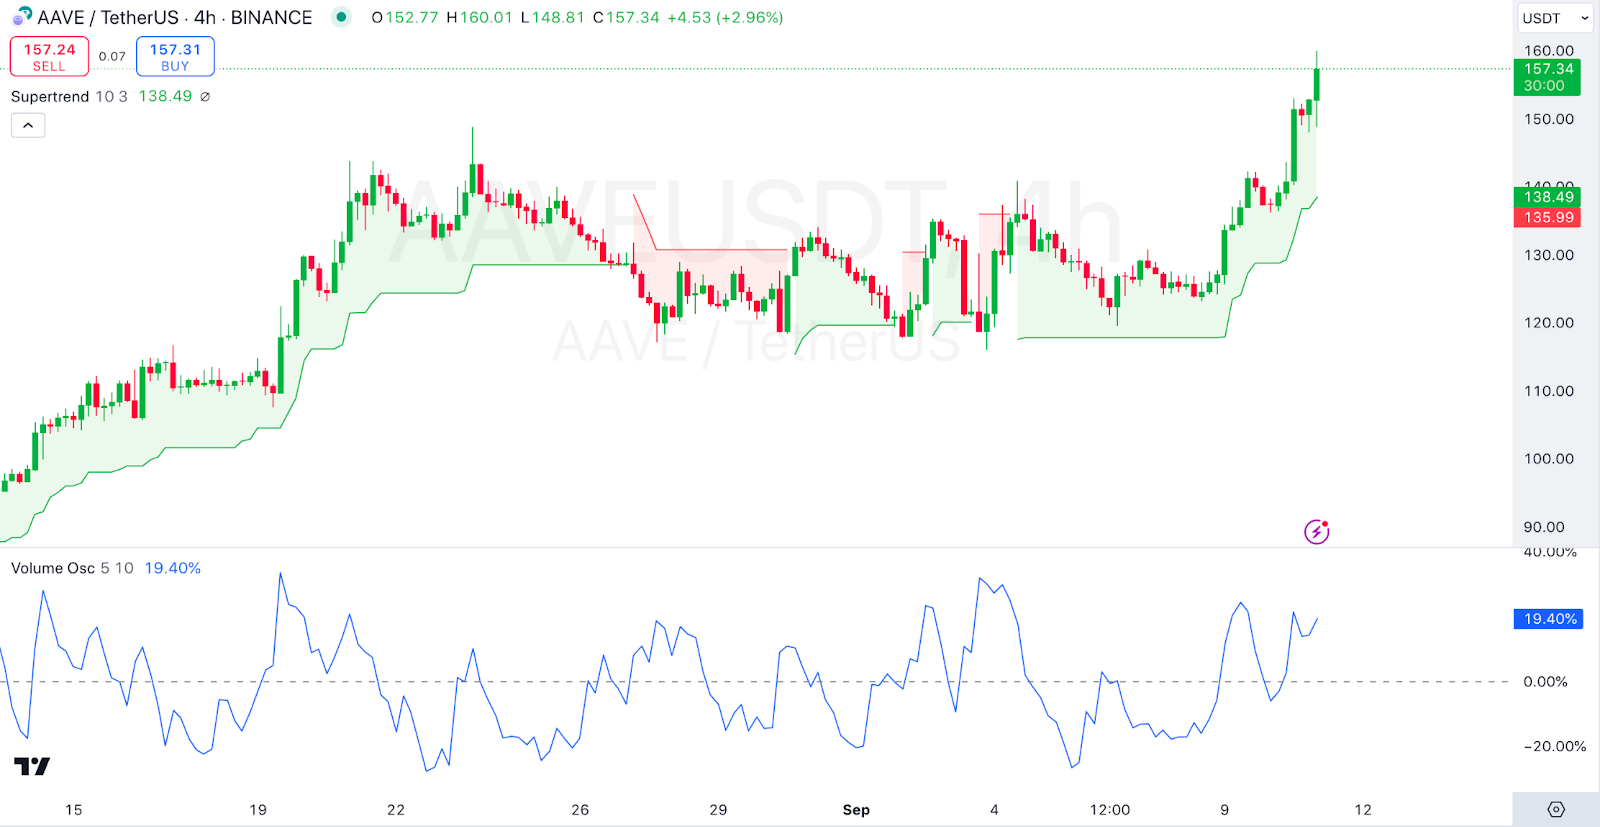
Aave, $AAVE, is also among the gainers in today’s session as seen from its price movements. Looking at an in-depth analysis, we see that Aave is currently trading above the supertrend line, indicating that the bullish trend remains intact. The price is making higher highs and higher lows, suggesting sustained upward momentum.
On the other hand, we see that the Volume Oscillator oscillator shows a recent uptick at 19.40%, indicating increasing interest in the market, which could support further upside. Internet Computer traded at $153.10 as of press time, representing a 11.29% increase over the last 24 hours.
Fetch.ai Price Review
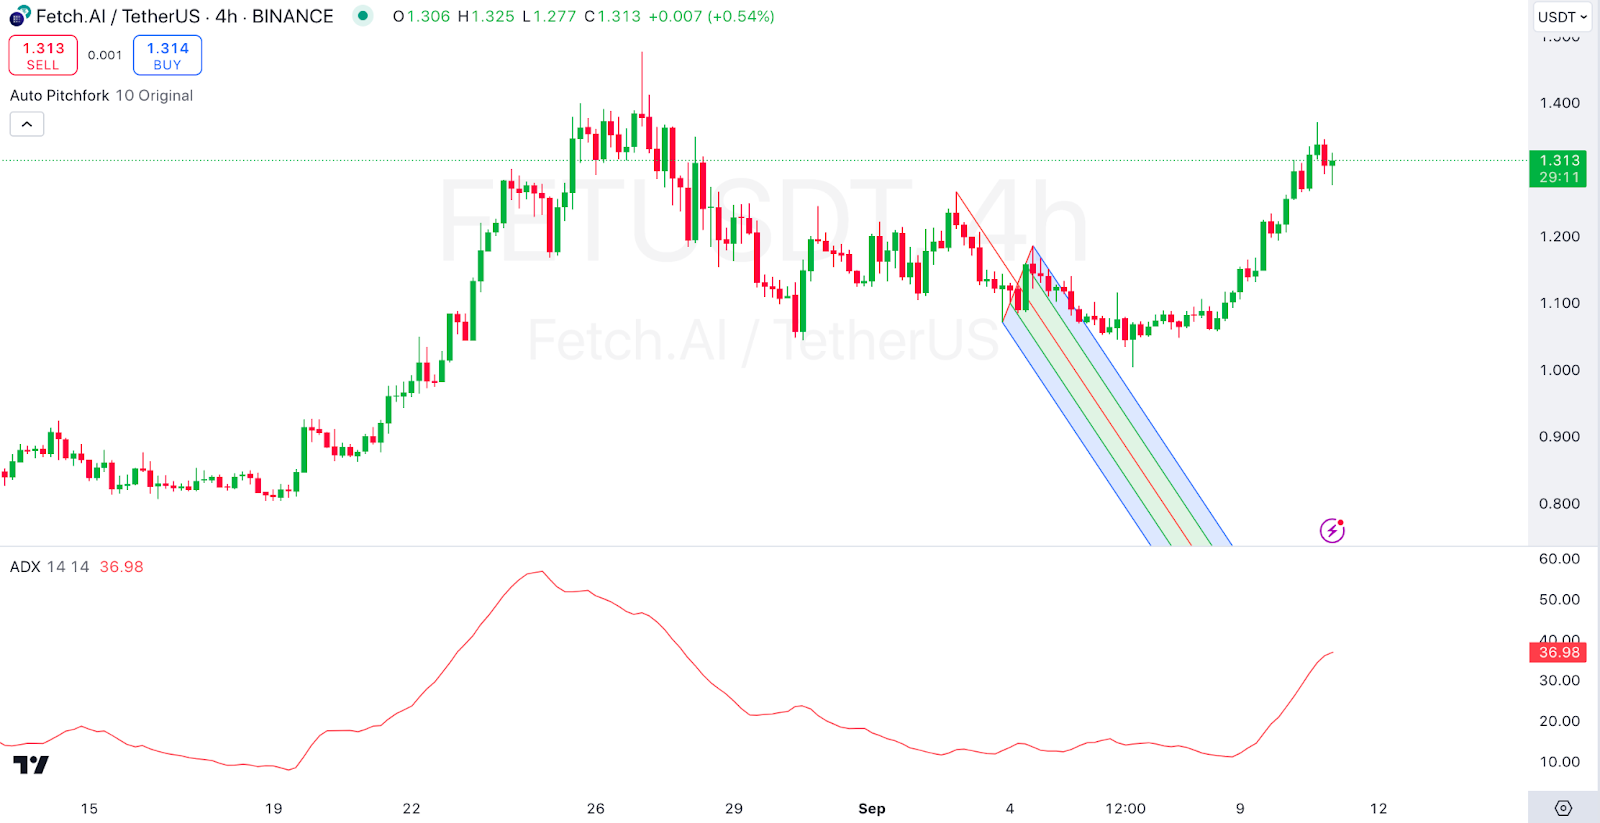
Fetch.ai, $FET, is also among the gainers in today’s session as seen from its price movements. Looking at an in-depth analysis, Fetch.AI has been following the upper band of the pitchfork channel, showing a strong upward trend. The Fetch.ai price is currently testing the resistance around $1.313, with potential for a breakout if momentum continues.
On the other hand, we see that the ADX is at 36.98 indicates a strong trend, suggesting that the upward movement could continue in the near term. However, the ADX is nearing a level where the trend might start weakening, so caution is advised. Fetch.ai traded at $1.31 as of press time, representing a 4.09% increase over the last 24 hours.